Project
Projects are the way you organise data and simulations in TheVirtualBrain. They correspond to directories where related data sets and simulation results are stored.
Information on the currently selected project is always available by clicking on the upper left corner of the interface:
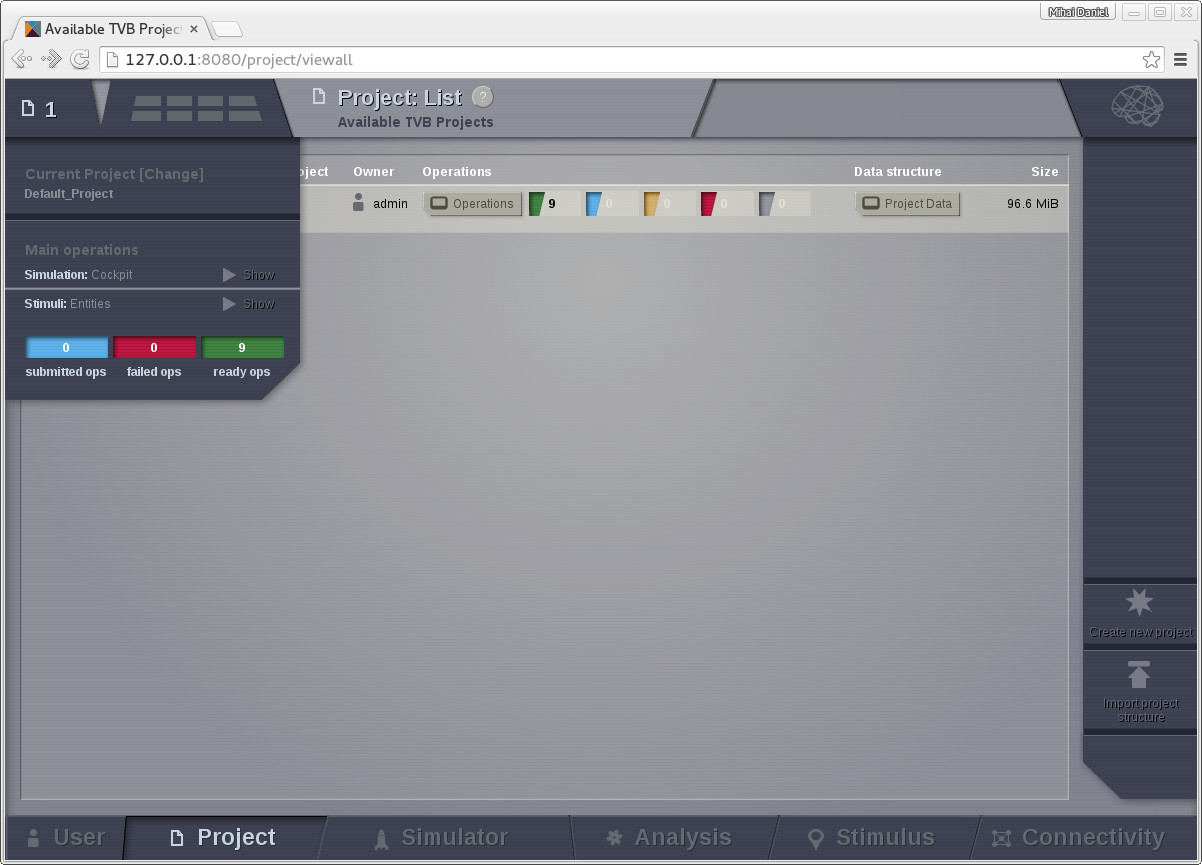
The main information about the selected project.
The Project tab provides access to the projects that you have created within TheVirtualBrain. The second level menu in the top left corner, next to the Project number, allows you to navigate between five main subpages, each of which is described in more detail in the sections below:
List of All Projects
Basic Properties
Operations
Data Structure
Saved Figures
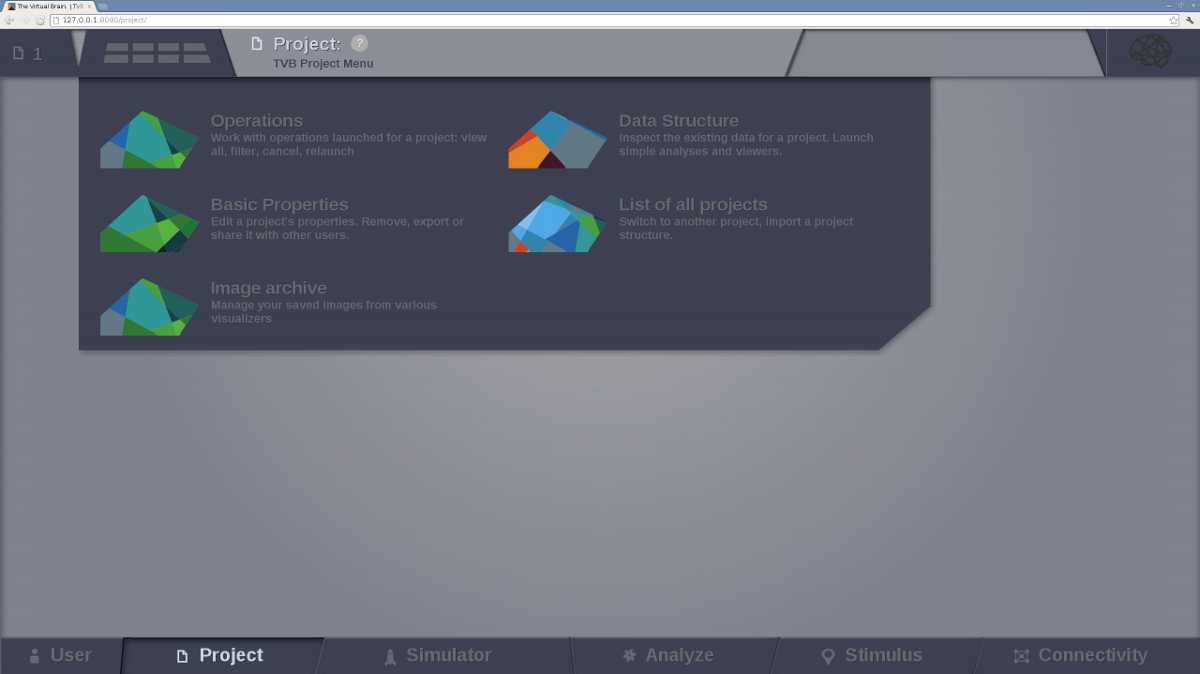
The Project second level menu
List of All Projects
This page provides an overview of all the existing projects.
The star column allows you to select the currently active project.
Some columns display basic information such as the id, name and owner of a project. The last column shows an estimated total size of a project. It is handy when you run out of disk space and want to clean up old big data.
The colored numbers represent the number of completed, in progress, pending, failed and cancelled operations.
The button columns are linking to the Basic properties, Operations and Data Structure pages for the project. Clicking any will also make that project the current one.
In addition to the list of existing projects, the right hand menu provides a way to:
Create a new project.
Import an existing project structure (for example, Exported from a colleague’s installation of TheVirtualBrain).
Upon first user registration, a default project is created for you:
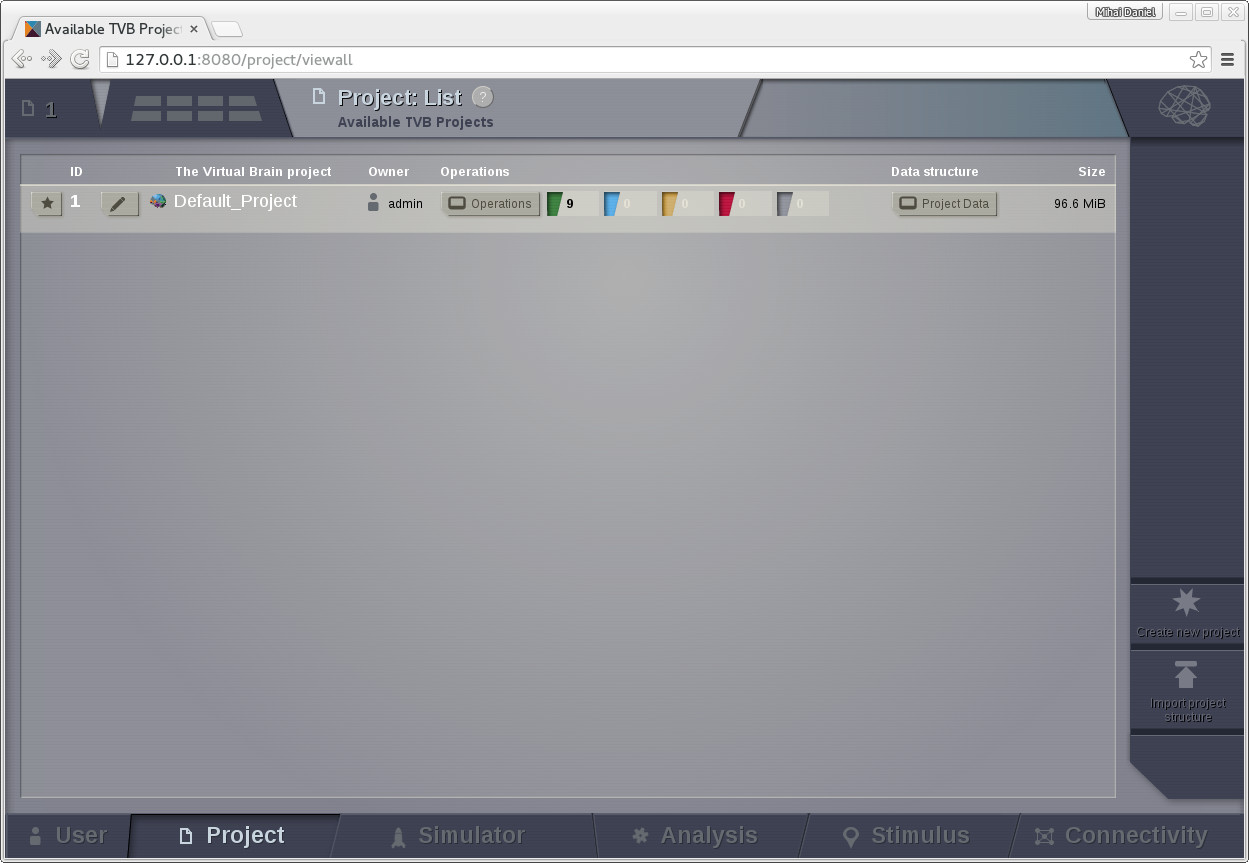
The default Project
Basic Properties
From this page you can export the project or delete it.
Also you can edit the current project’s properties. You are directed to this page when you first create a new project:
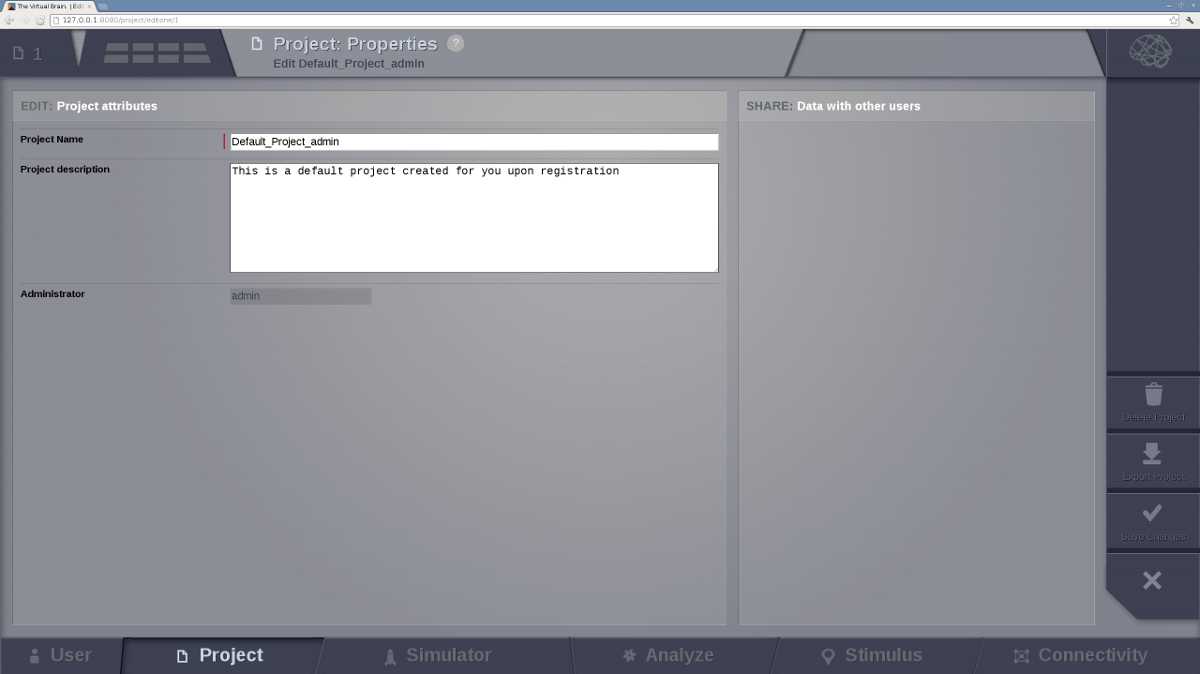
The Project Properties page
Note that the project name may not contain spaces.
If there are other users registered in the framework, you can choose to share the project with them by checking their respective “Visible for” boxes.
On the right side of the browser there is the Action Column. There are buttons to delete or export the project. The last two buttons allow you to save changes or go back to the List of All Projects page.
If you were creating a new project it should now be visible.
Warning
Project properties cannot be edited while operations are running!
Image Archive
TheVirtualBrain provides you with the possibility of saving image snapshots.
From this page you can manage all the images stored within the current working Project, as well as:
edit figure title,
create categories to group your images,
search through your figure collection,
visualize, download and delete your images.
Note
Only the current project figures will be available. If you want to visualize images from another project, you will have to switch to that project.
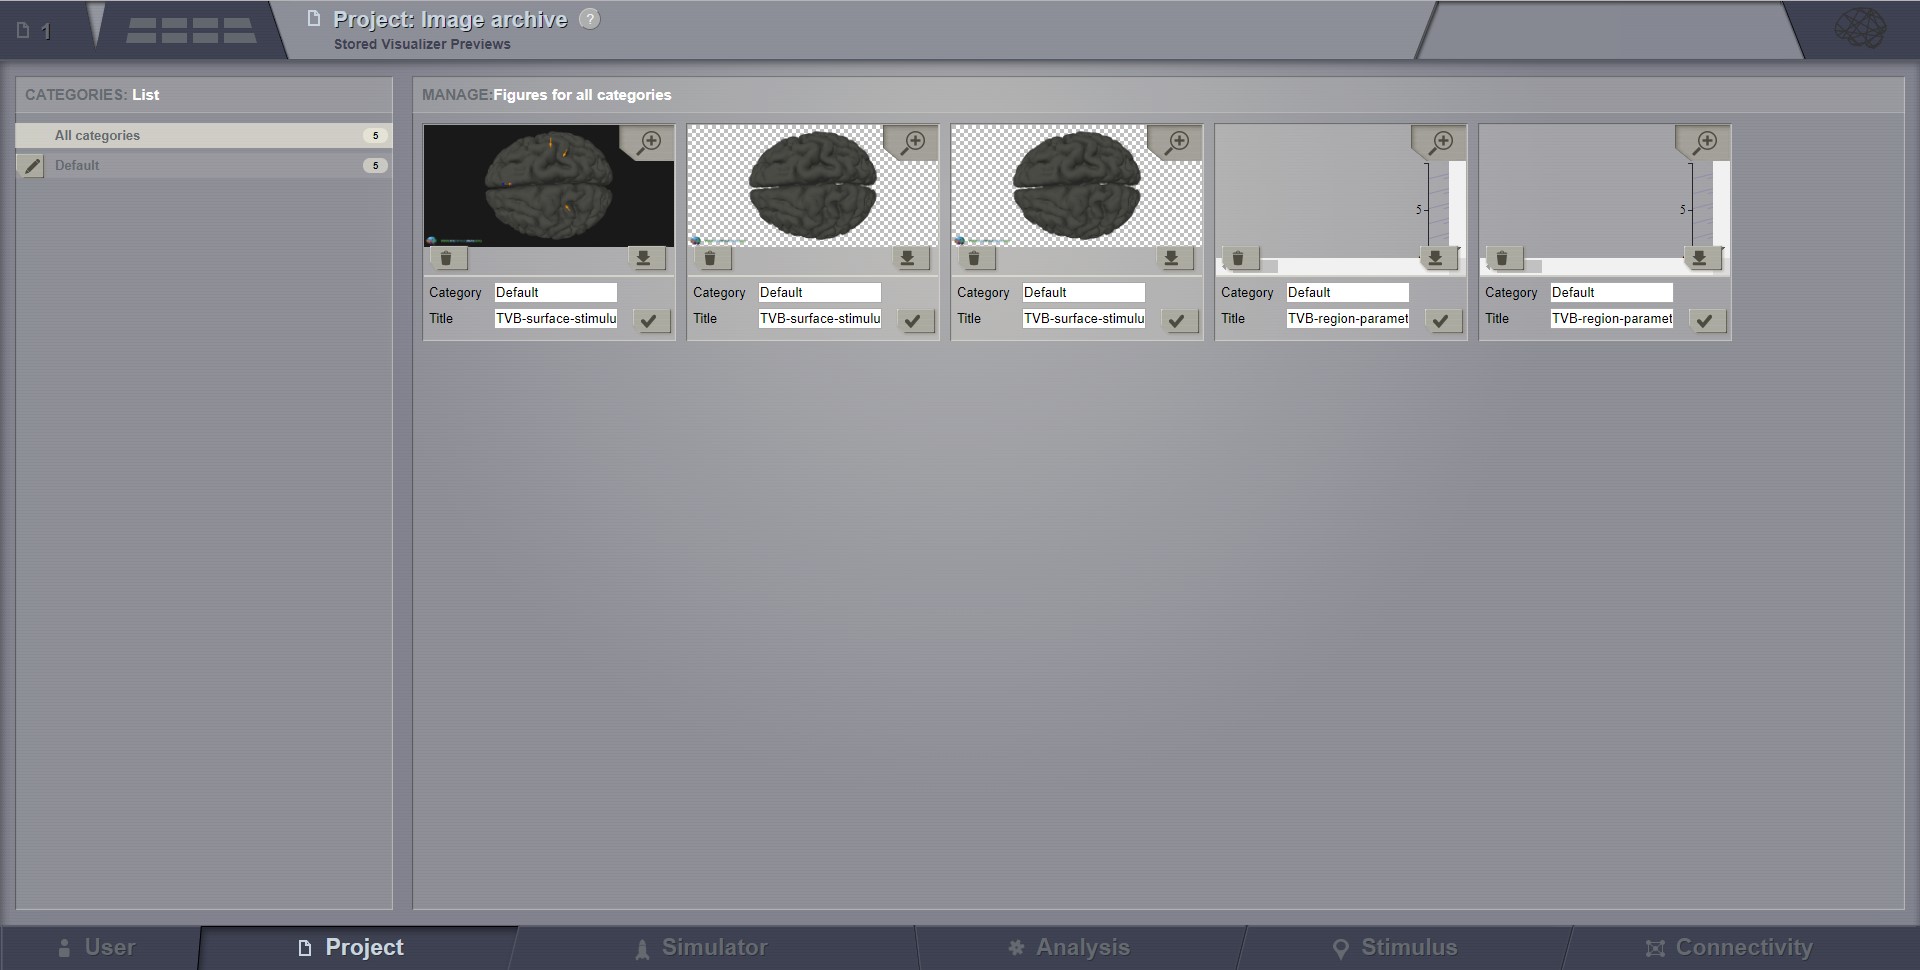
The Image Archive page
Operations
A table with the history of operations related to the currently selected project is displayed. From this board the user can filter, view, reload or cancel any operation:
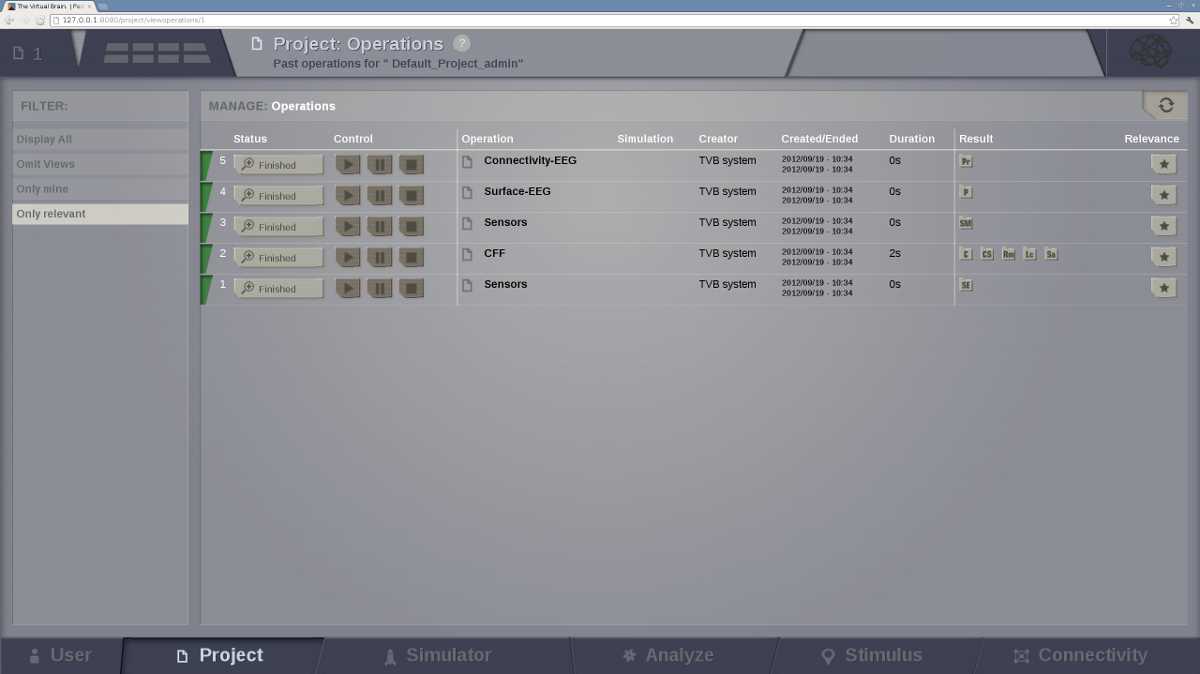
The operation page with default operations
Data Structure
This page shows all datatypes of a project in a tree view.
This tree has three levels. Each level groups the datatypes. The first level groups by the state of a datatype, then each state group is further divided in groups for each subject. The leaf nodes are all datatypes of the project.
You can change the criteria of this grouping. Experiment with the level1 and level2 drop down menus found above the tree.
Besides grouping the datatypes you may also filter them. The left-most area of the Data Structure page contains basic filters for the centrally displayed entities. We display fixed filters (entities declared relevant / irrelevant) of free-text filtering (when using the input text field and then pressing Button ‘Filter’). Filtering based on free-text searches into all fields of an entity, and it is case insensitive.

The data structure of the default project.
Note that the color of the datatype icons in the tree view indicate their category:
Green are the raw datatypes. These are mostly imported in TVB (eg. connectivities, surfaces, sensors etc.)
Yellow are adjacent datatypes. These usually imported in TVB (eg. lookup tables and matrices etc.)
Red are time series datatypes either created by simulations or imported.
Blue are analyser results.
Pink are some datatypes created by TVB (eg. stimuli, local connectivities etc.)
Selecting a data node in the Tree structure causes an overlay to appear.
From this overlay, the user can:
edit metadata
launch Analyzers and Visualizers
link data to other projects
export data.
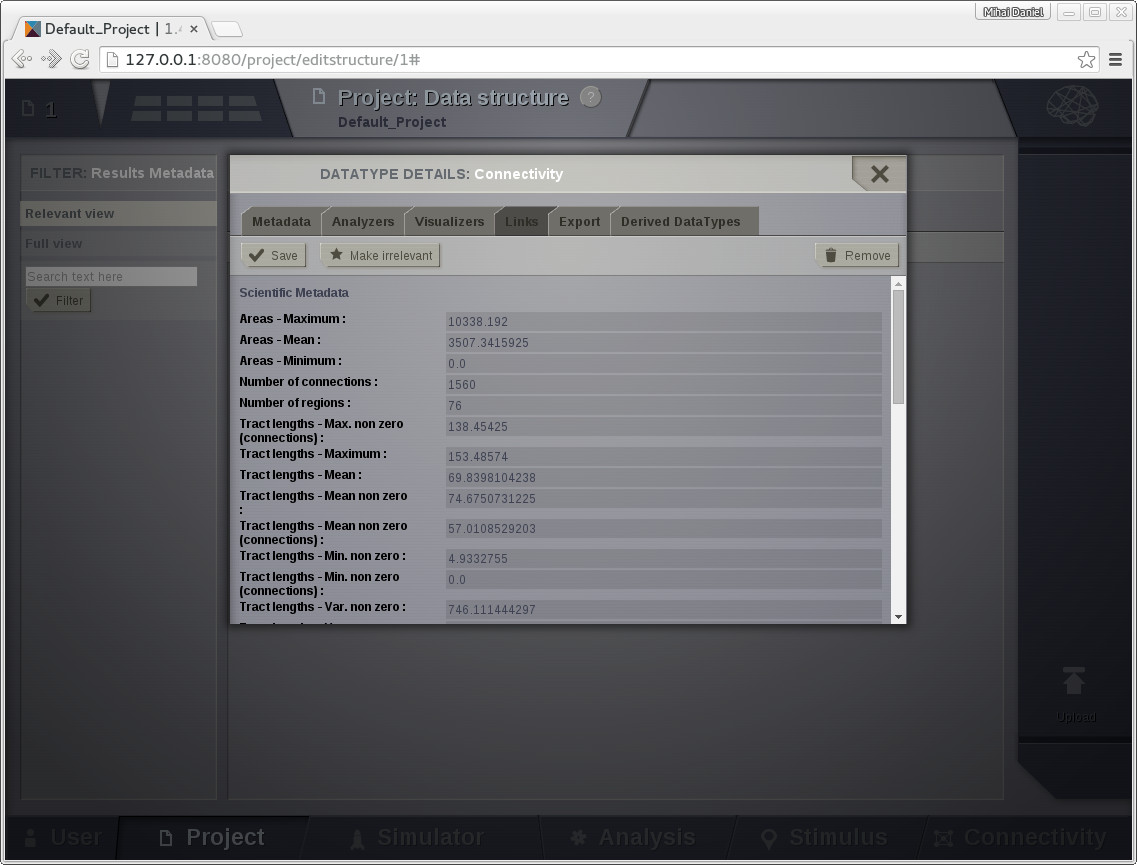
A data nodes overlay
On the most-right area of this page, an upload button appears. This launches an overlay with tabs for each type of TVB-compatible data:
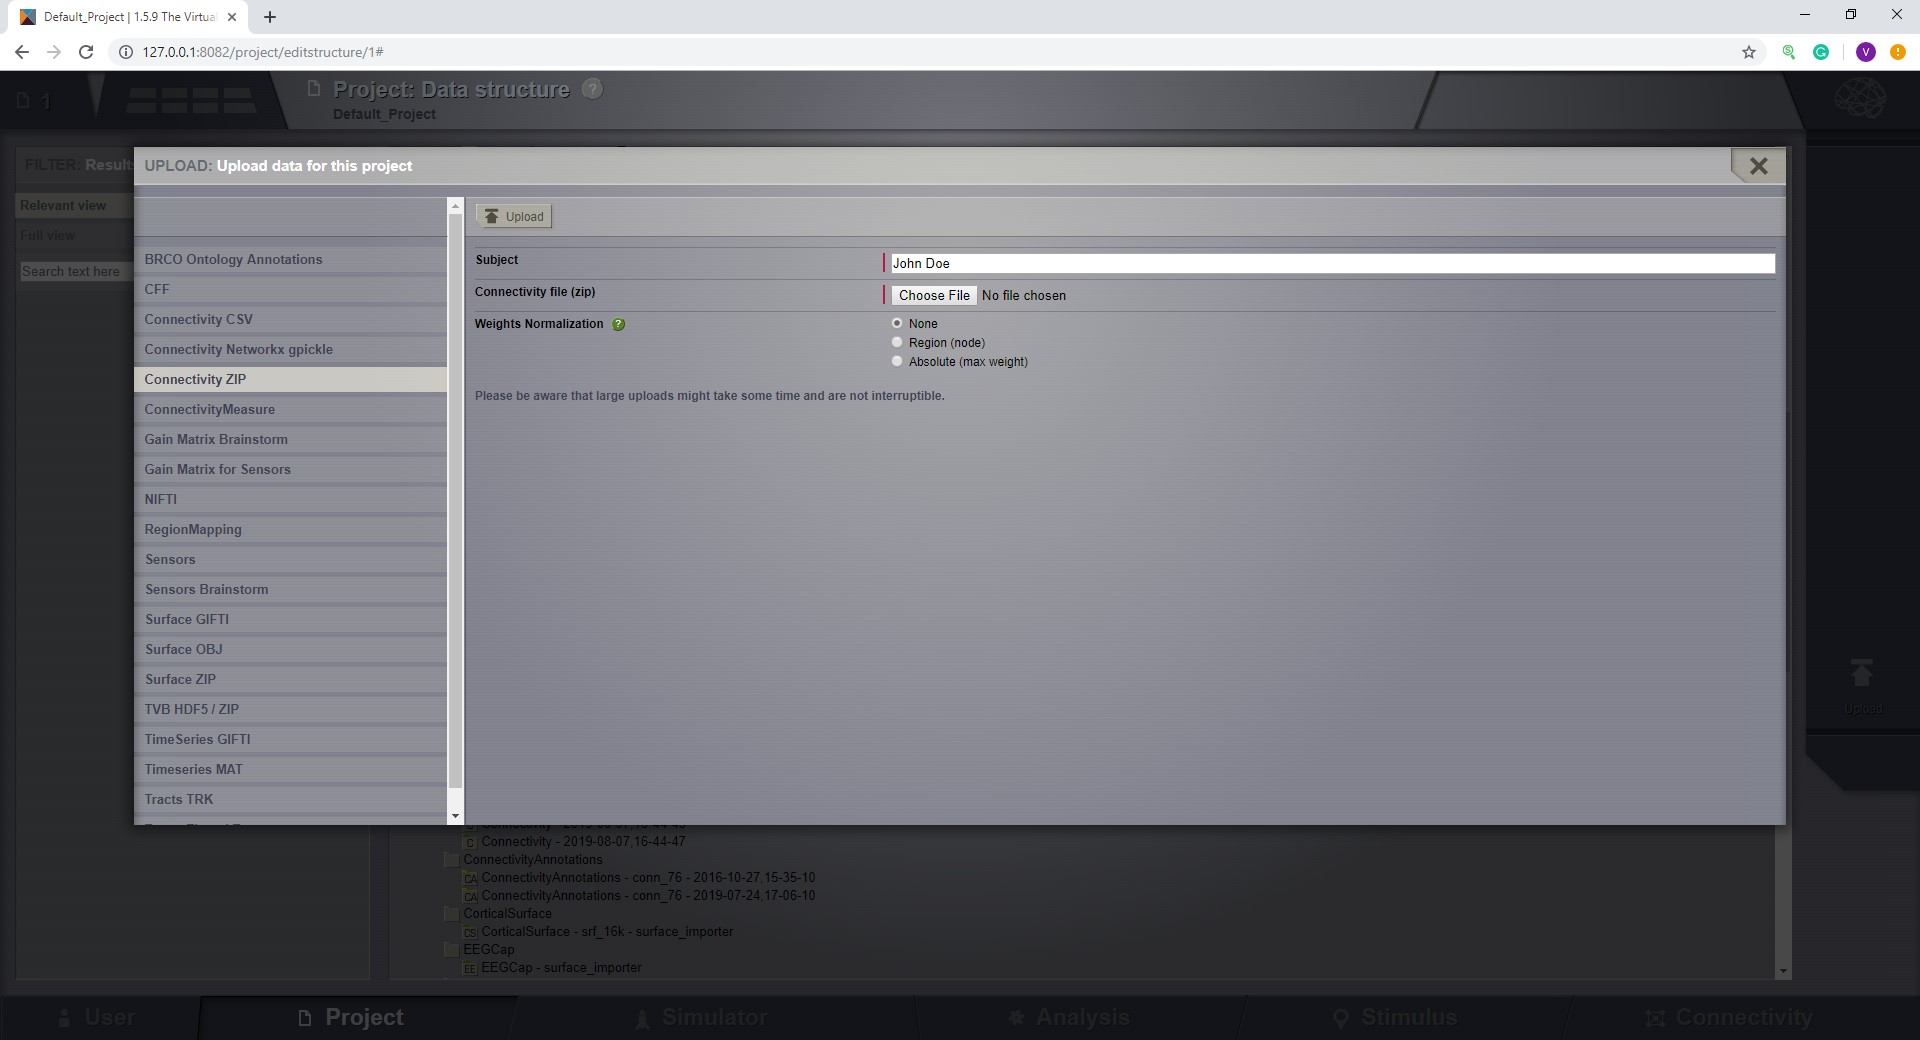
The data upload overlay
For a detailed description of the supported file formats see TheVirtualBrain Data Formats
Launching any uploader with success will generate you a new leaf in the Tree displayed centrally on this page.