Getting Started
First things first. We are going to use tvb-data which is present within the distribution (at TVB_Distribution/tvb_data/Lib/site-packages/tvb-data) or it can be downloaded from here. Other than that, please follow this link to download the ModelingEpilepsy.zip project.
Objectives
This tutorial presents the basic steps to upload a project, and share data with other users and/or link data to other TVB projects. After this tutorial you should be able to import a new dataset, create, import, export and delete a project and share your data with among your projects or with a colleague.
Adding A New User
In this exercise we will assume that multiple users are working with the same TVB installation.
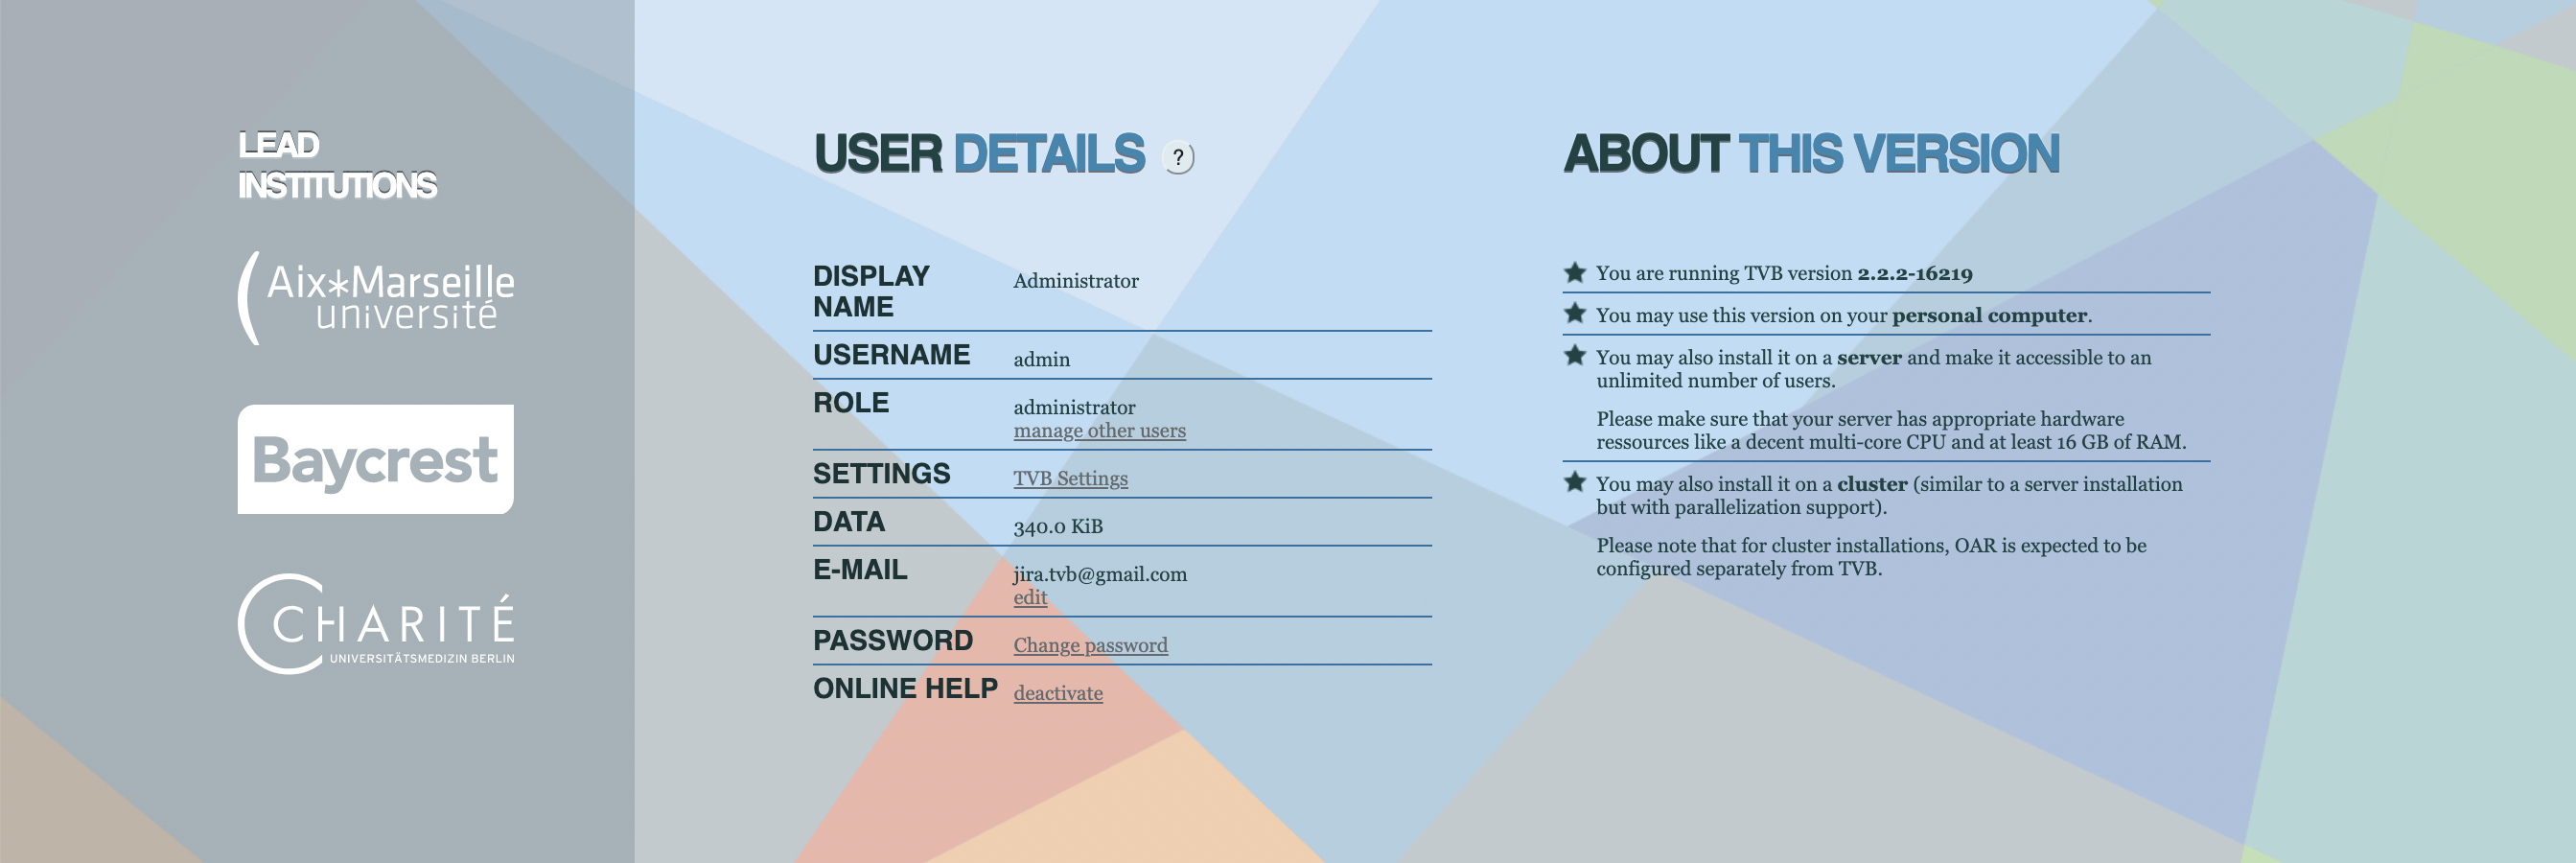
By default your are the Admin user.
Change the admin email.
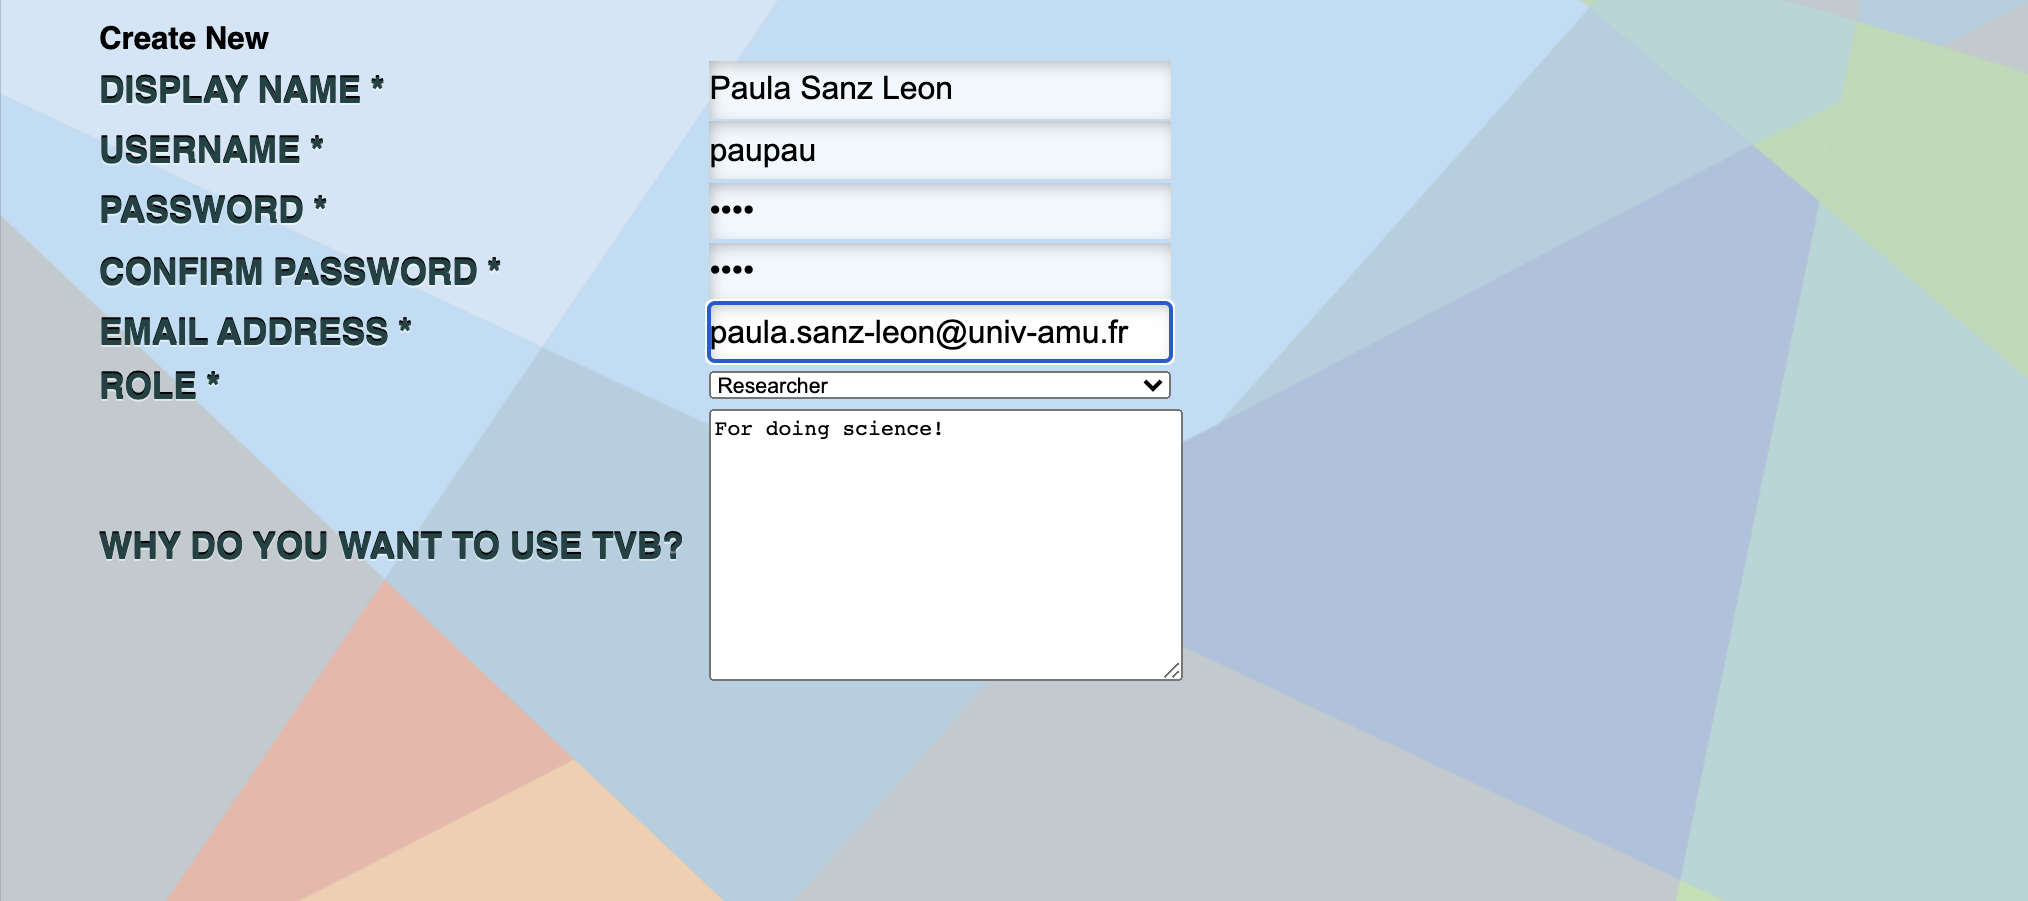
Create a user for someone else by registering a new user.
You’ll receive a notification email.
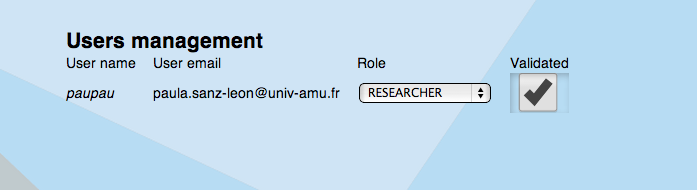
Make sure the new user has been validated.
Login with the Admin account.
Creating, Importing, Exporting and Deleting Projects
We assume that you have already created an account on your machine. If not, you can always work with the default account admin.
Normally when you start TVB you should have the Default Project from tvb_data already imported. If you don’t have it, go to step 4 to see how you can import a new project.
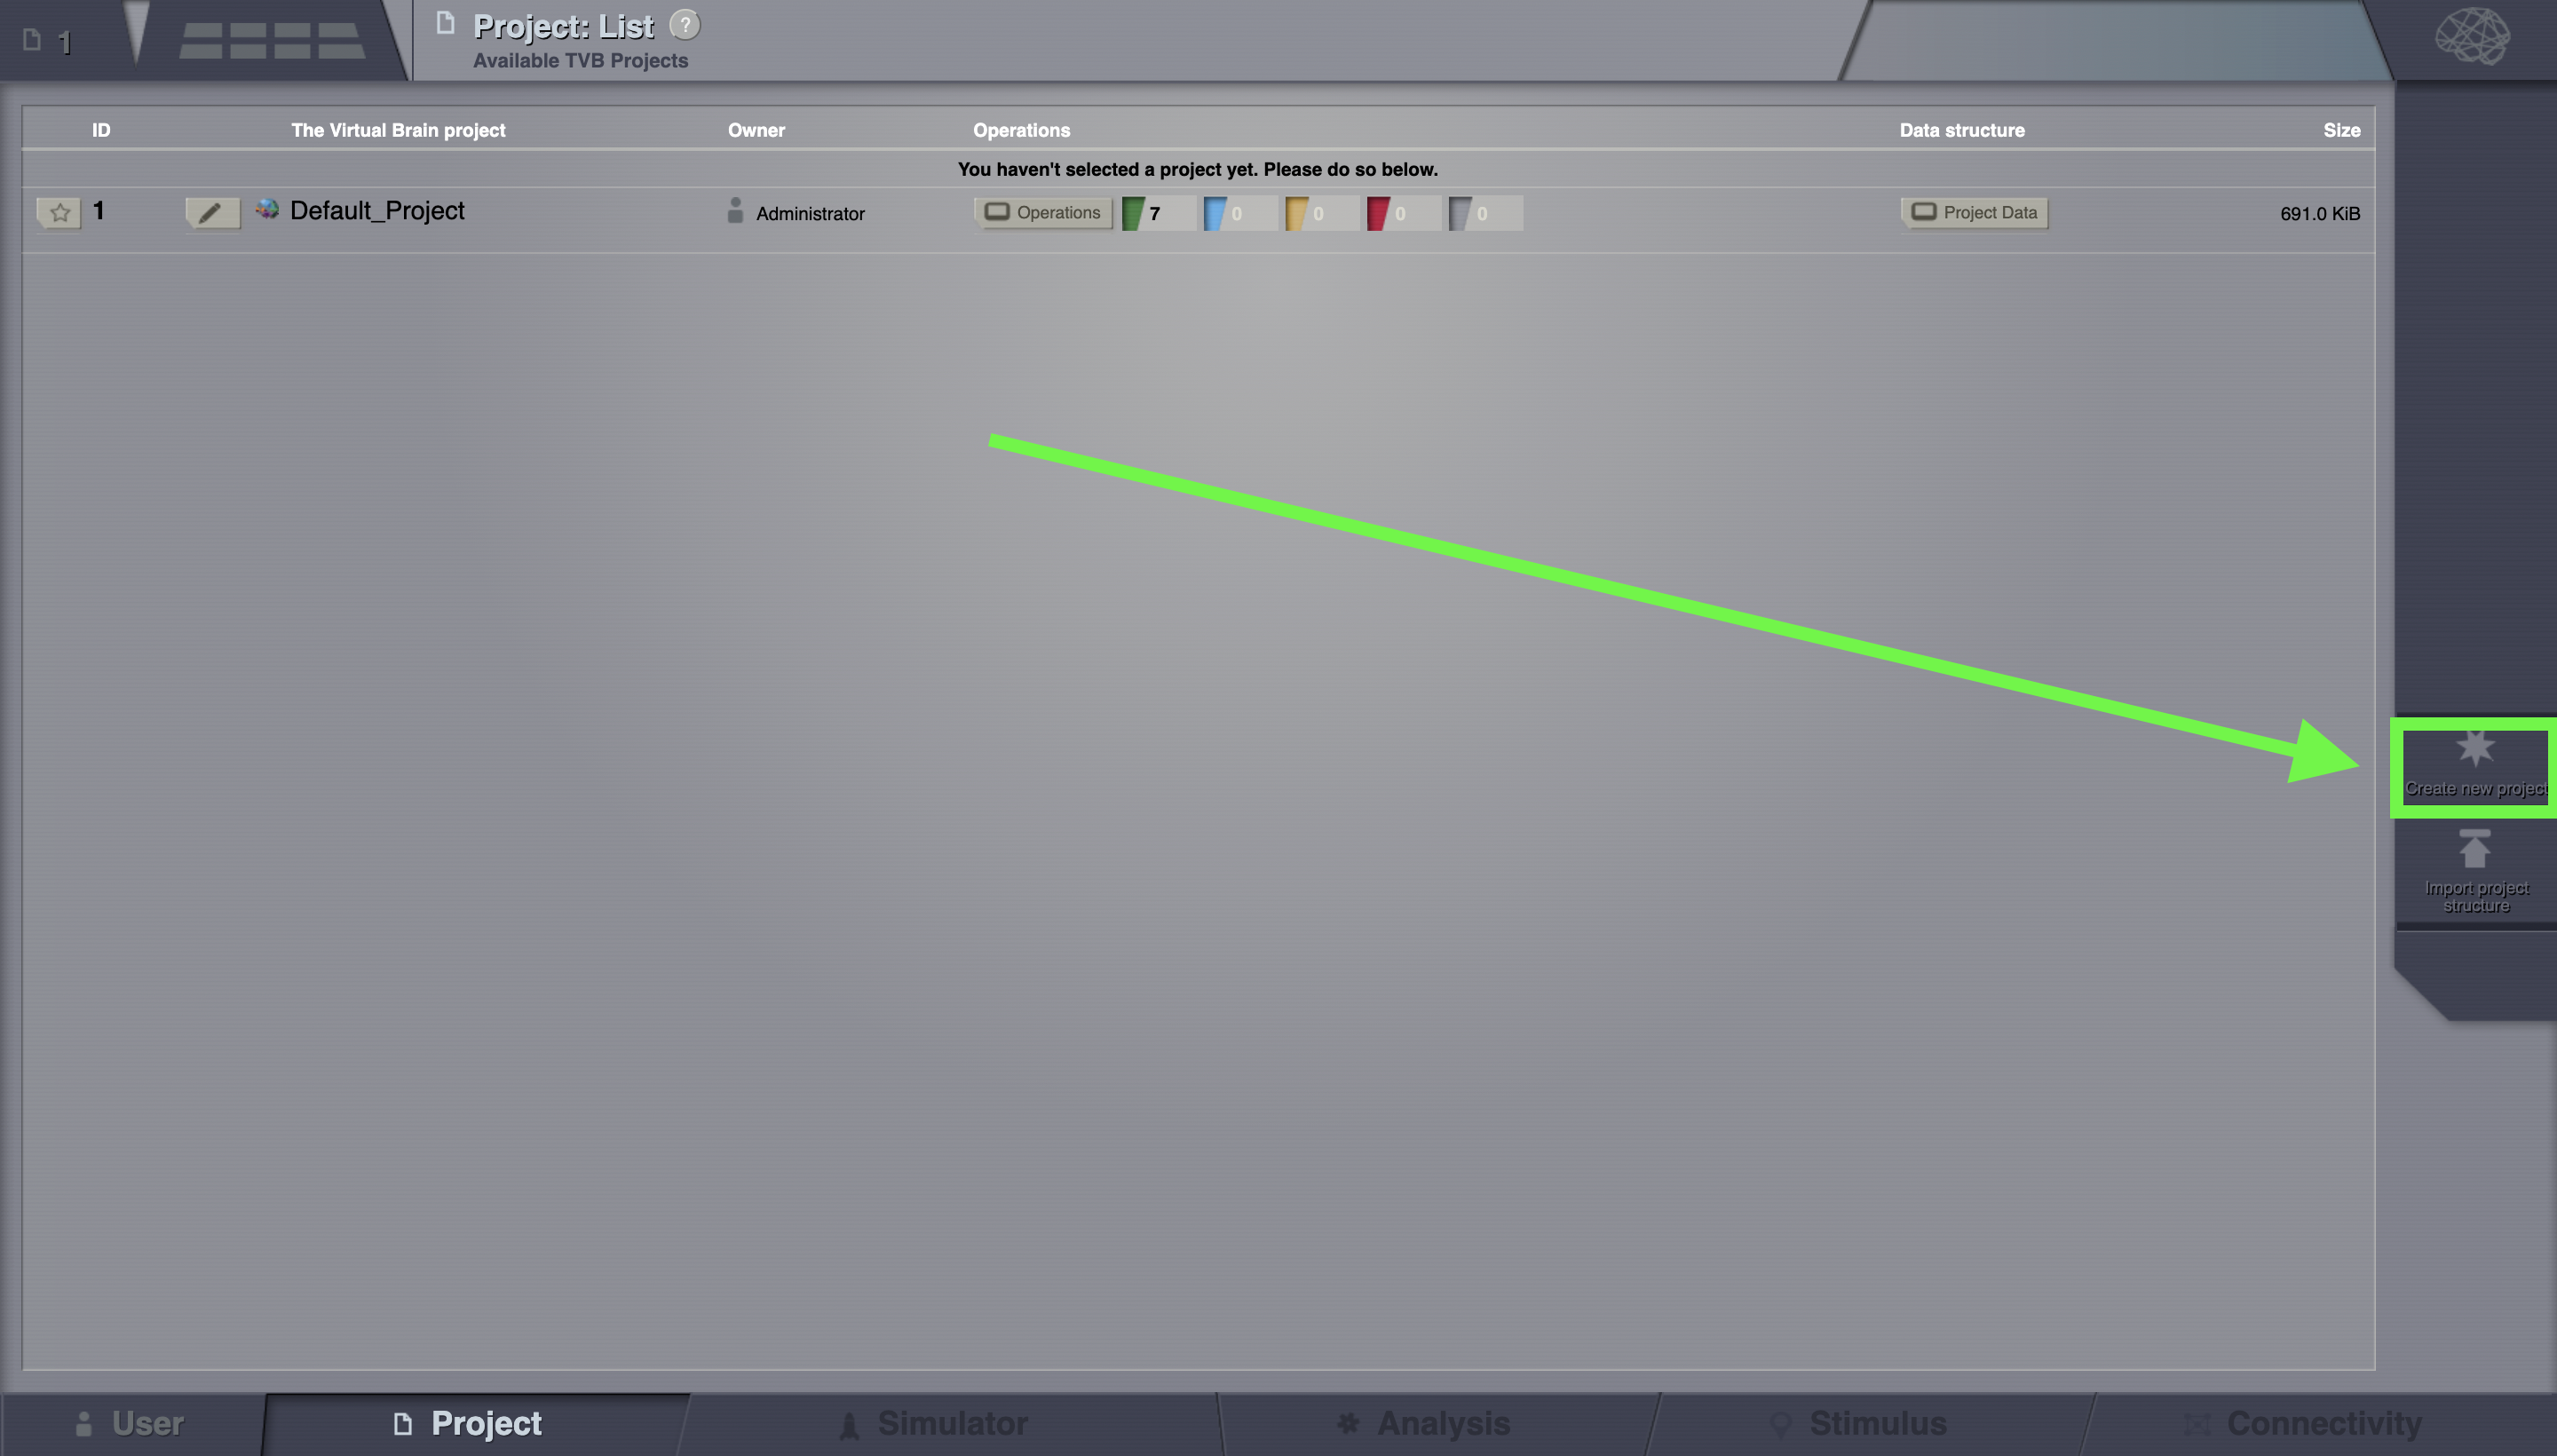
Go to Project > List of all projects.
On the right column, bottom corner, click on Create new project.
Choose a project name (e.g. NewProject) and optionally add a description as well. On the right column, bottom corner, click on Save Changes when you are done.
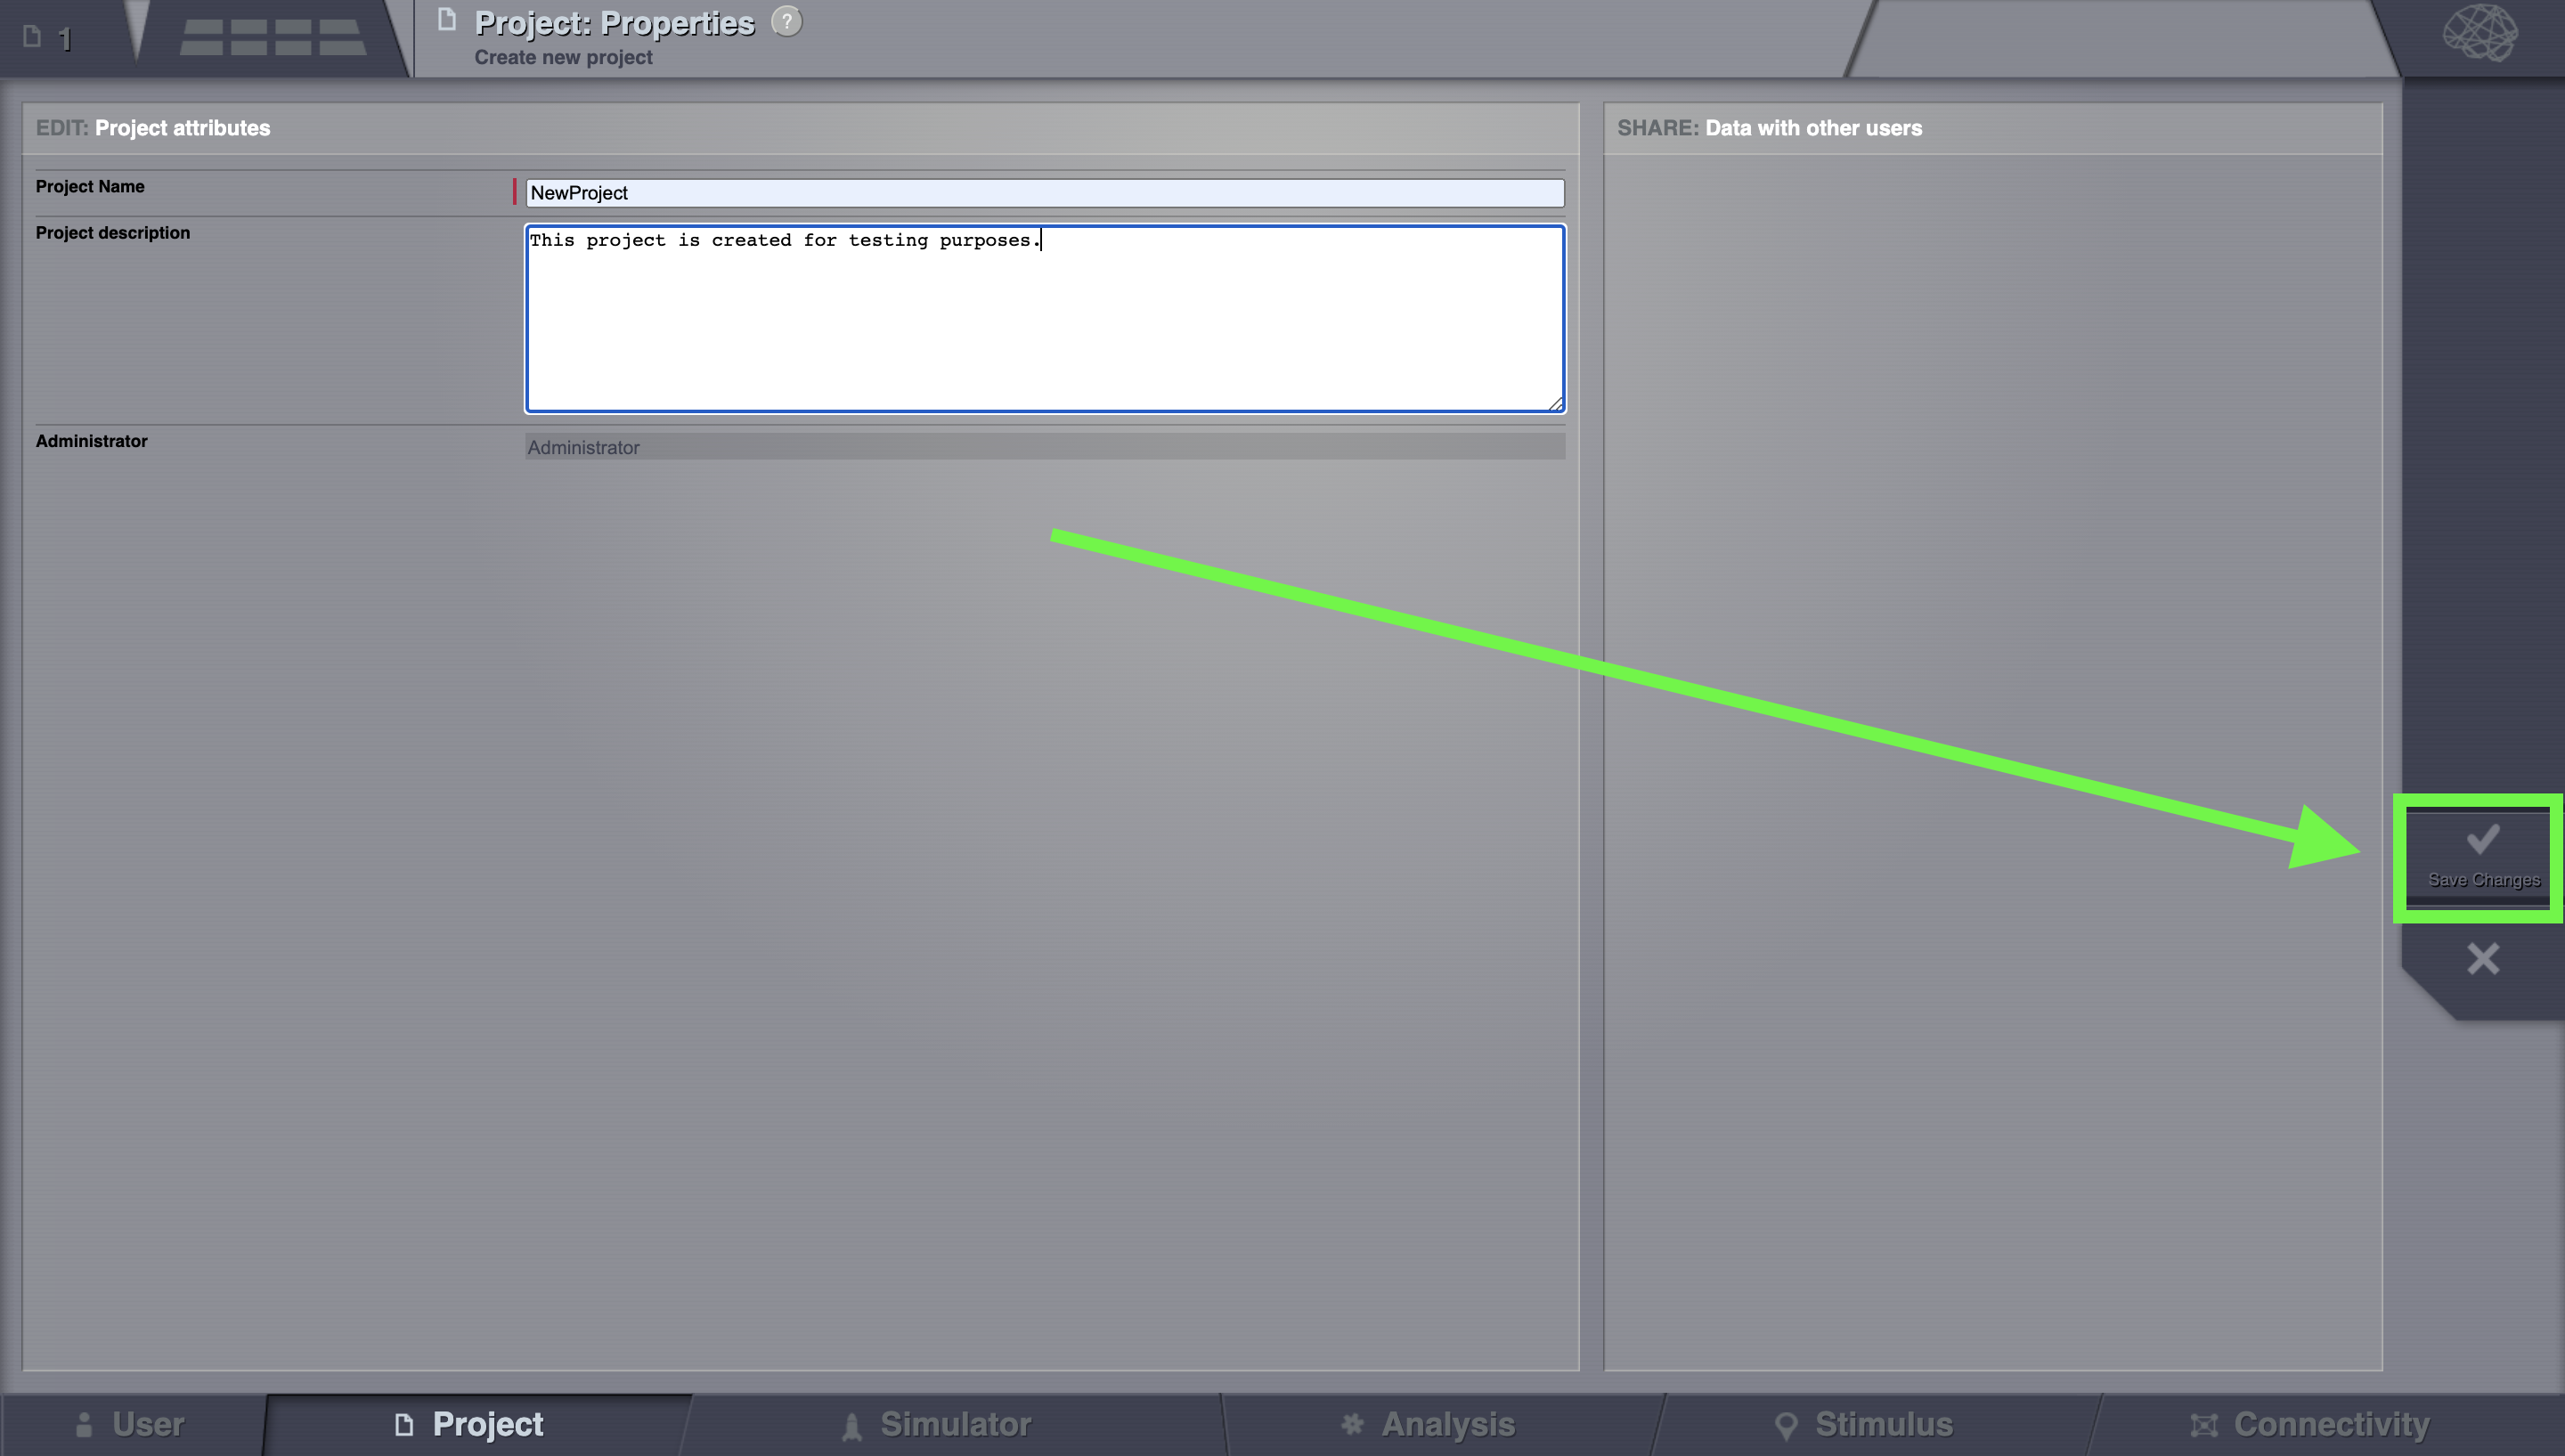
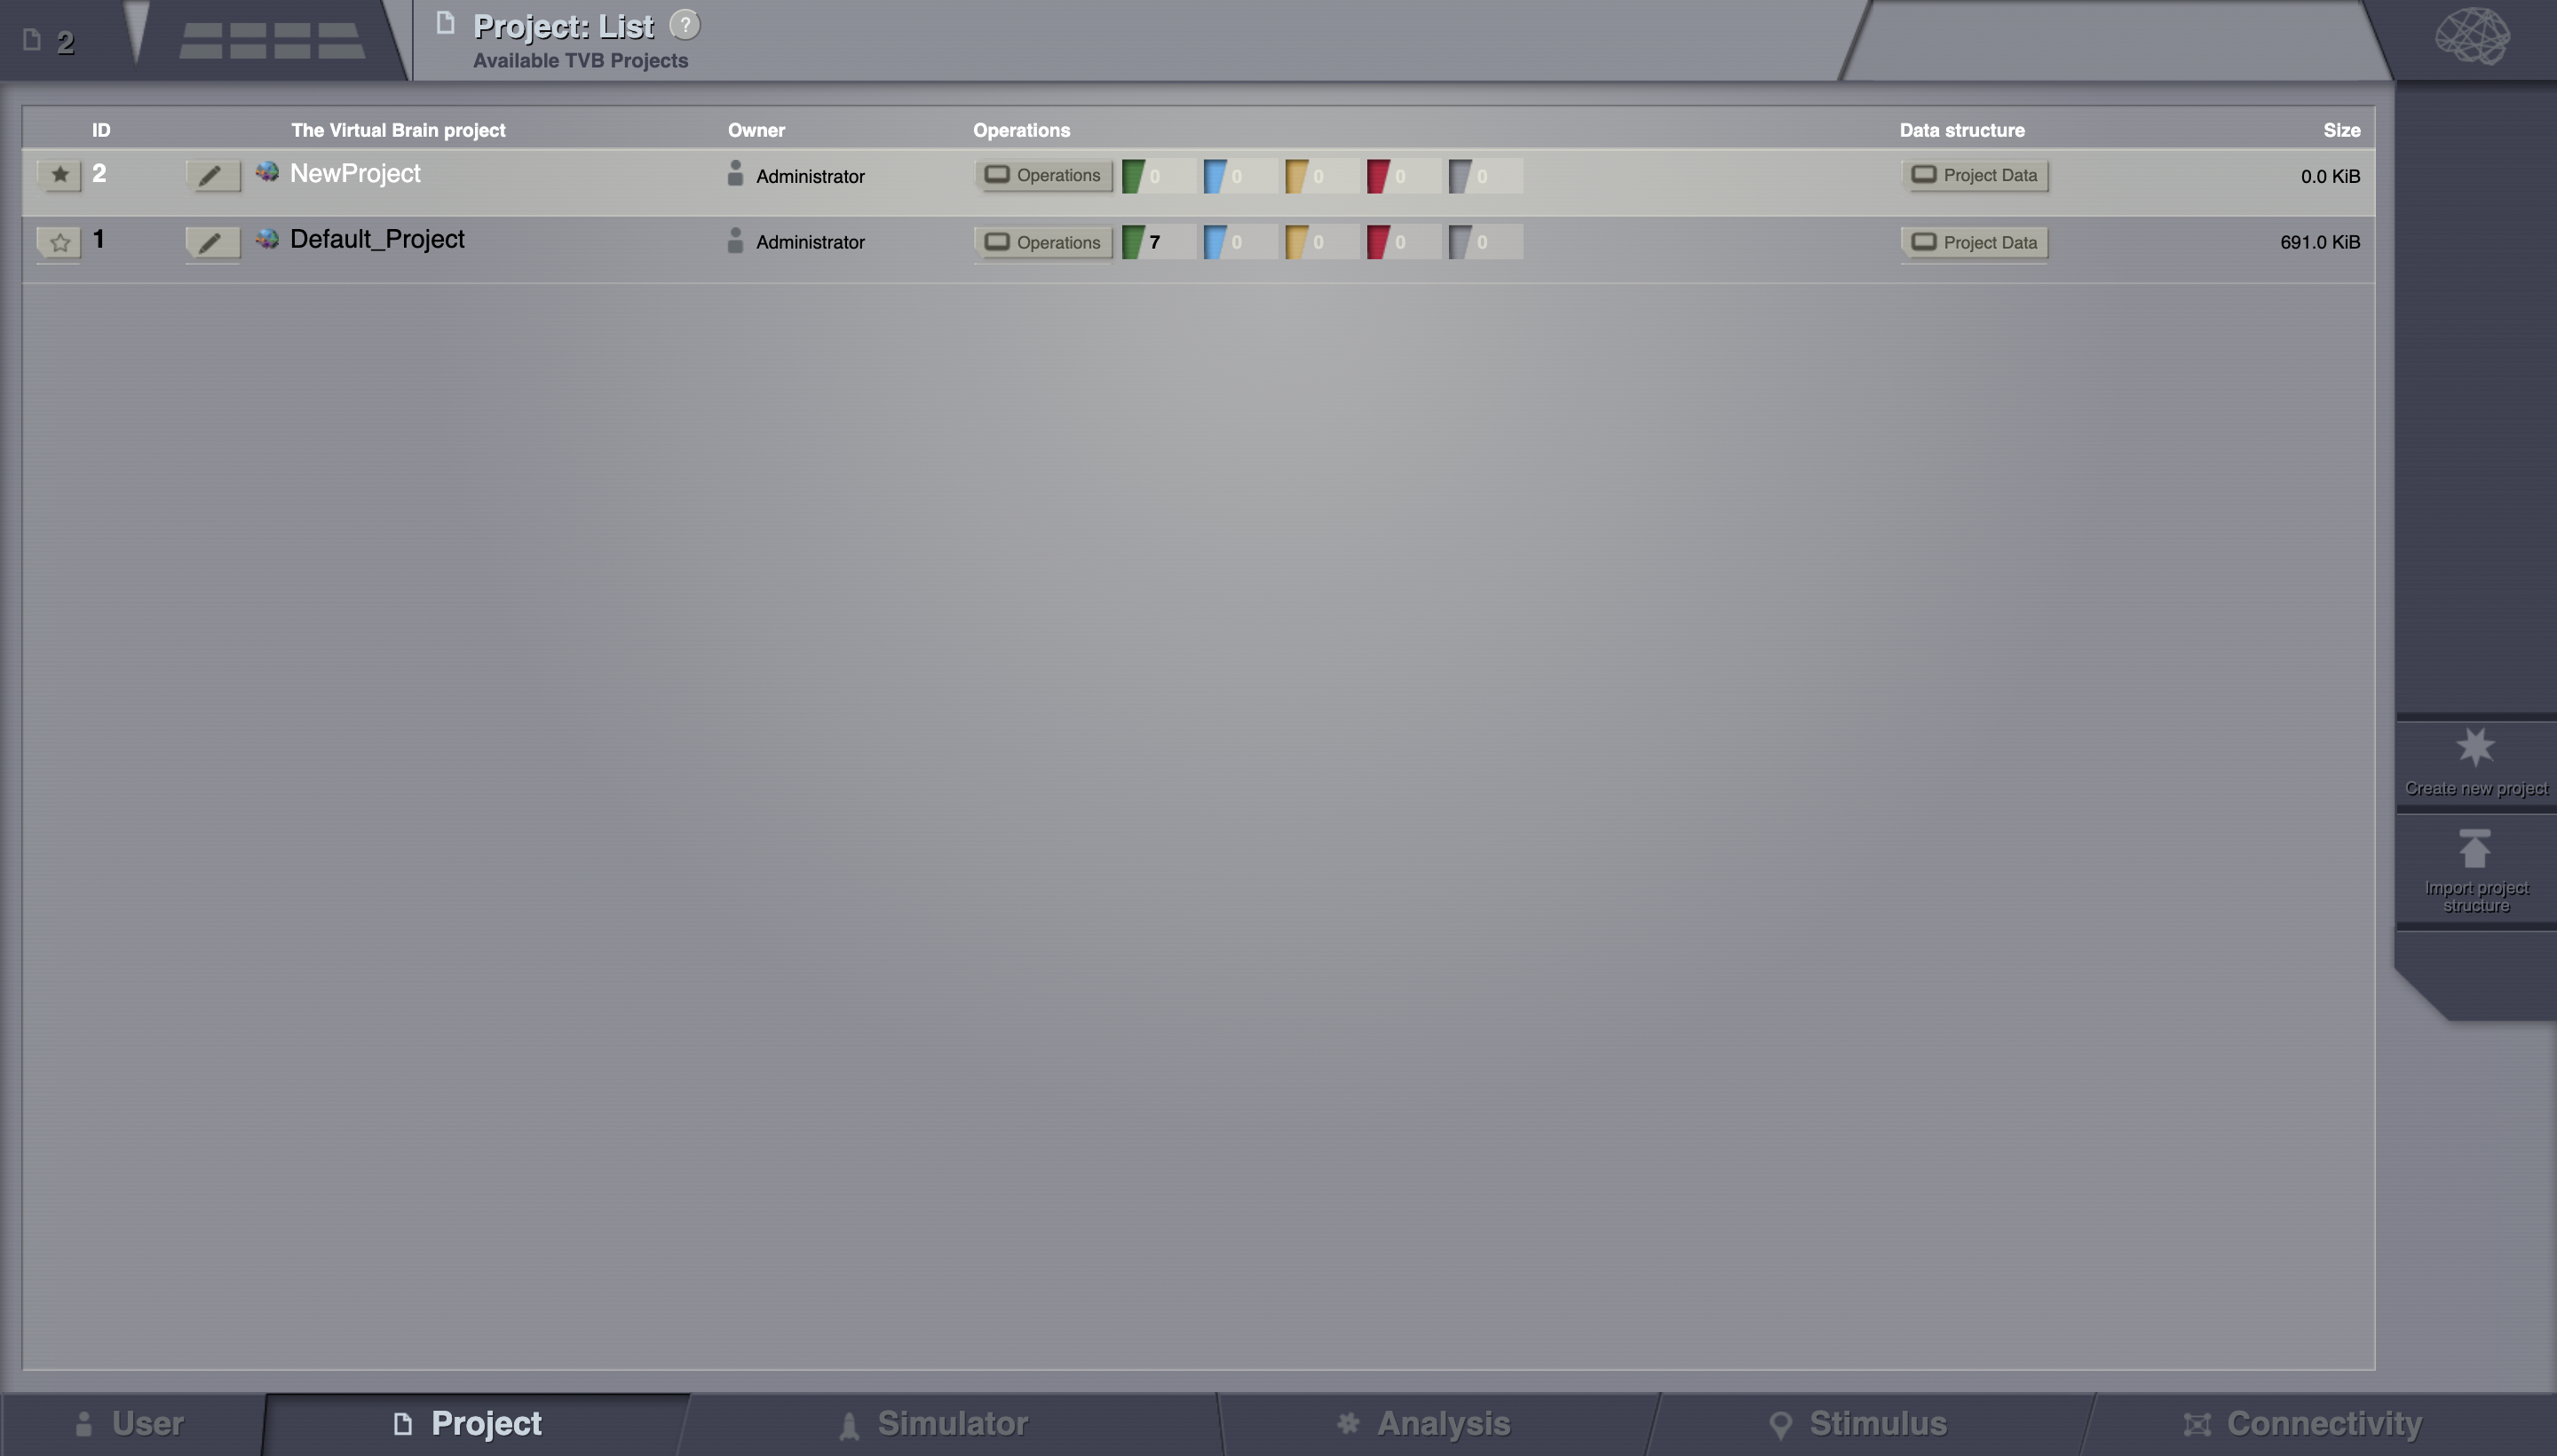
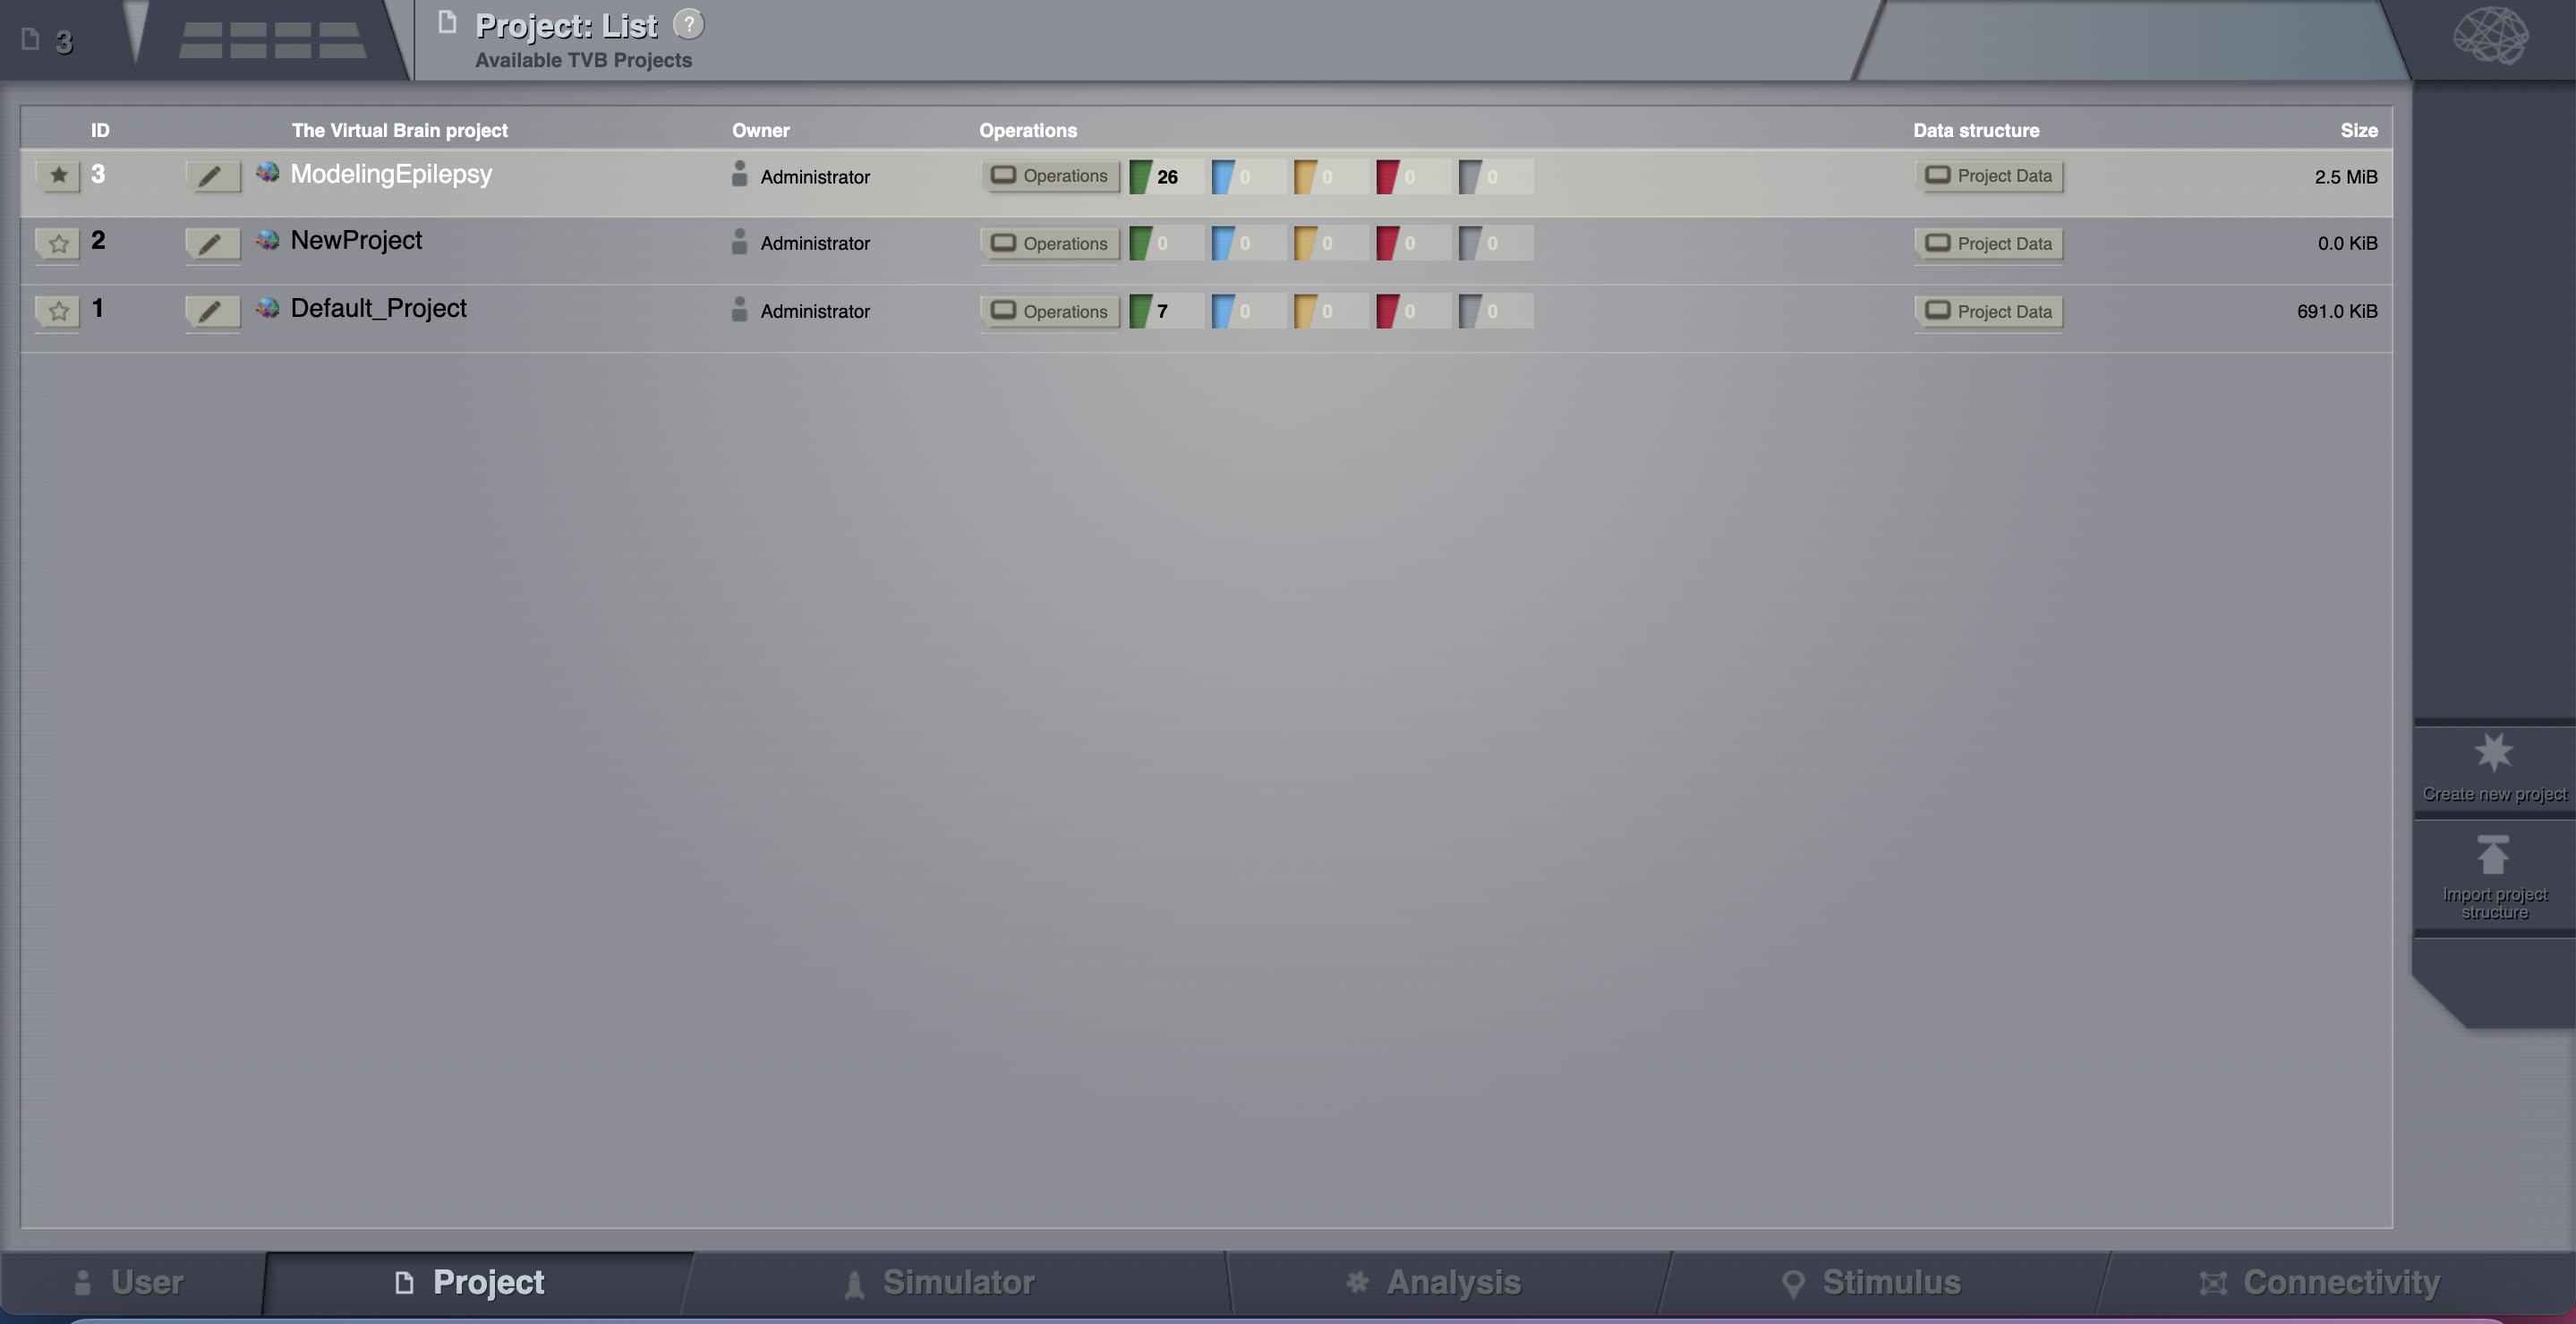
The new project will appear in the list of all projects.
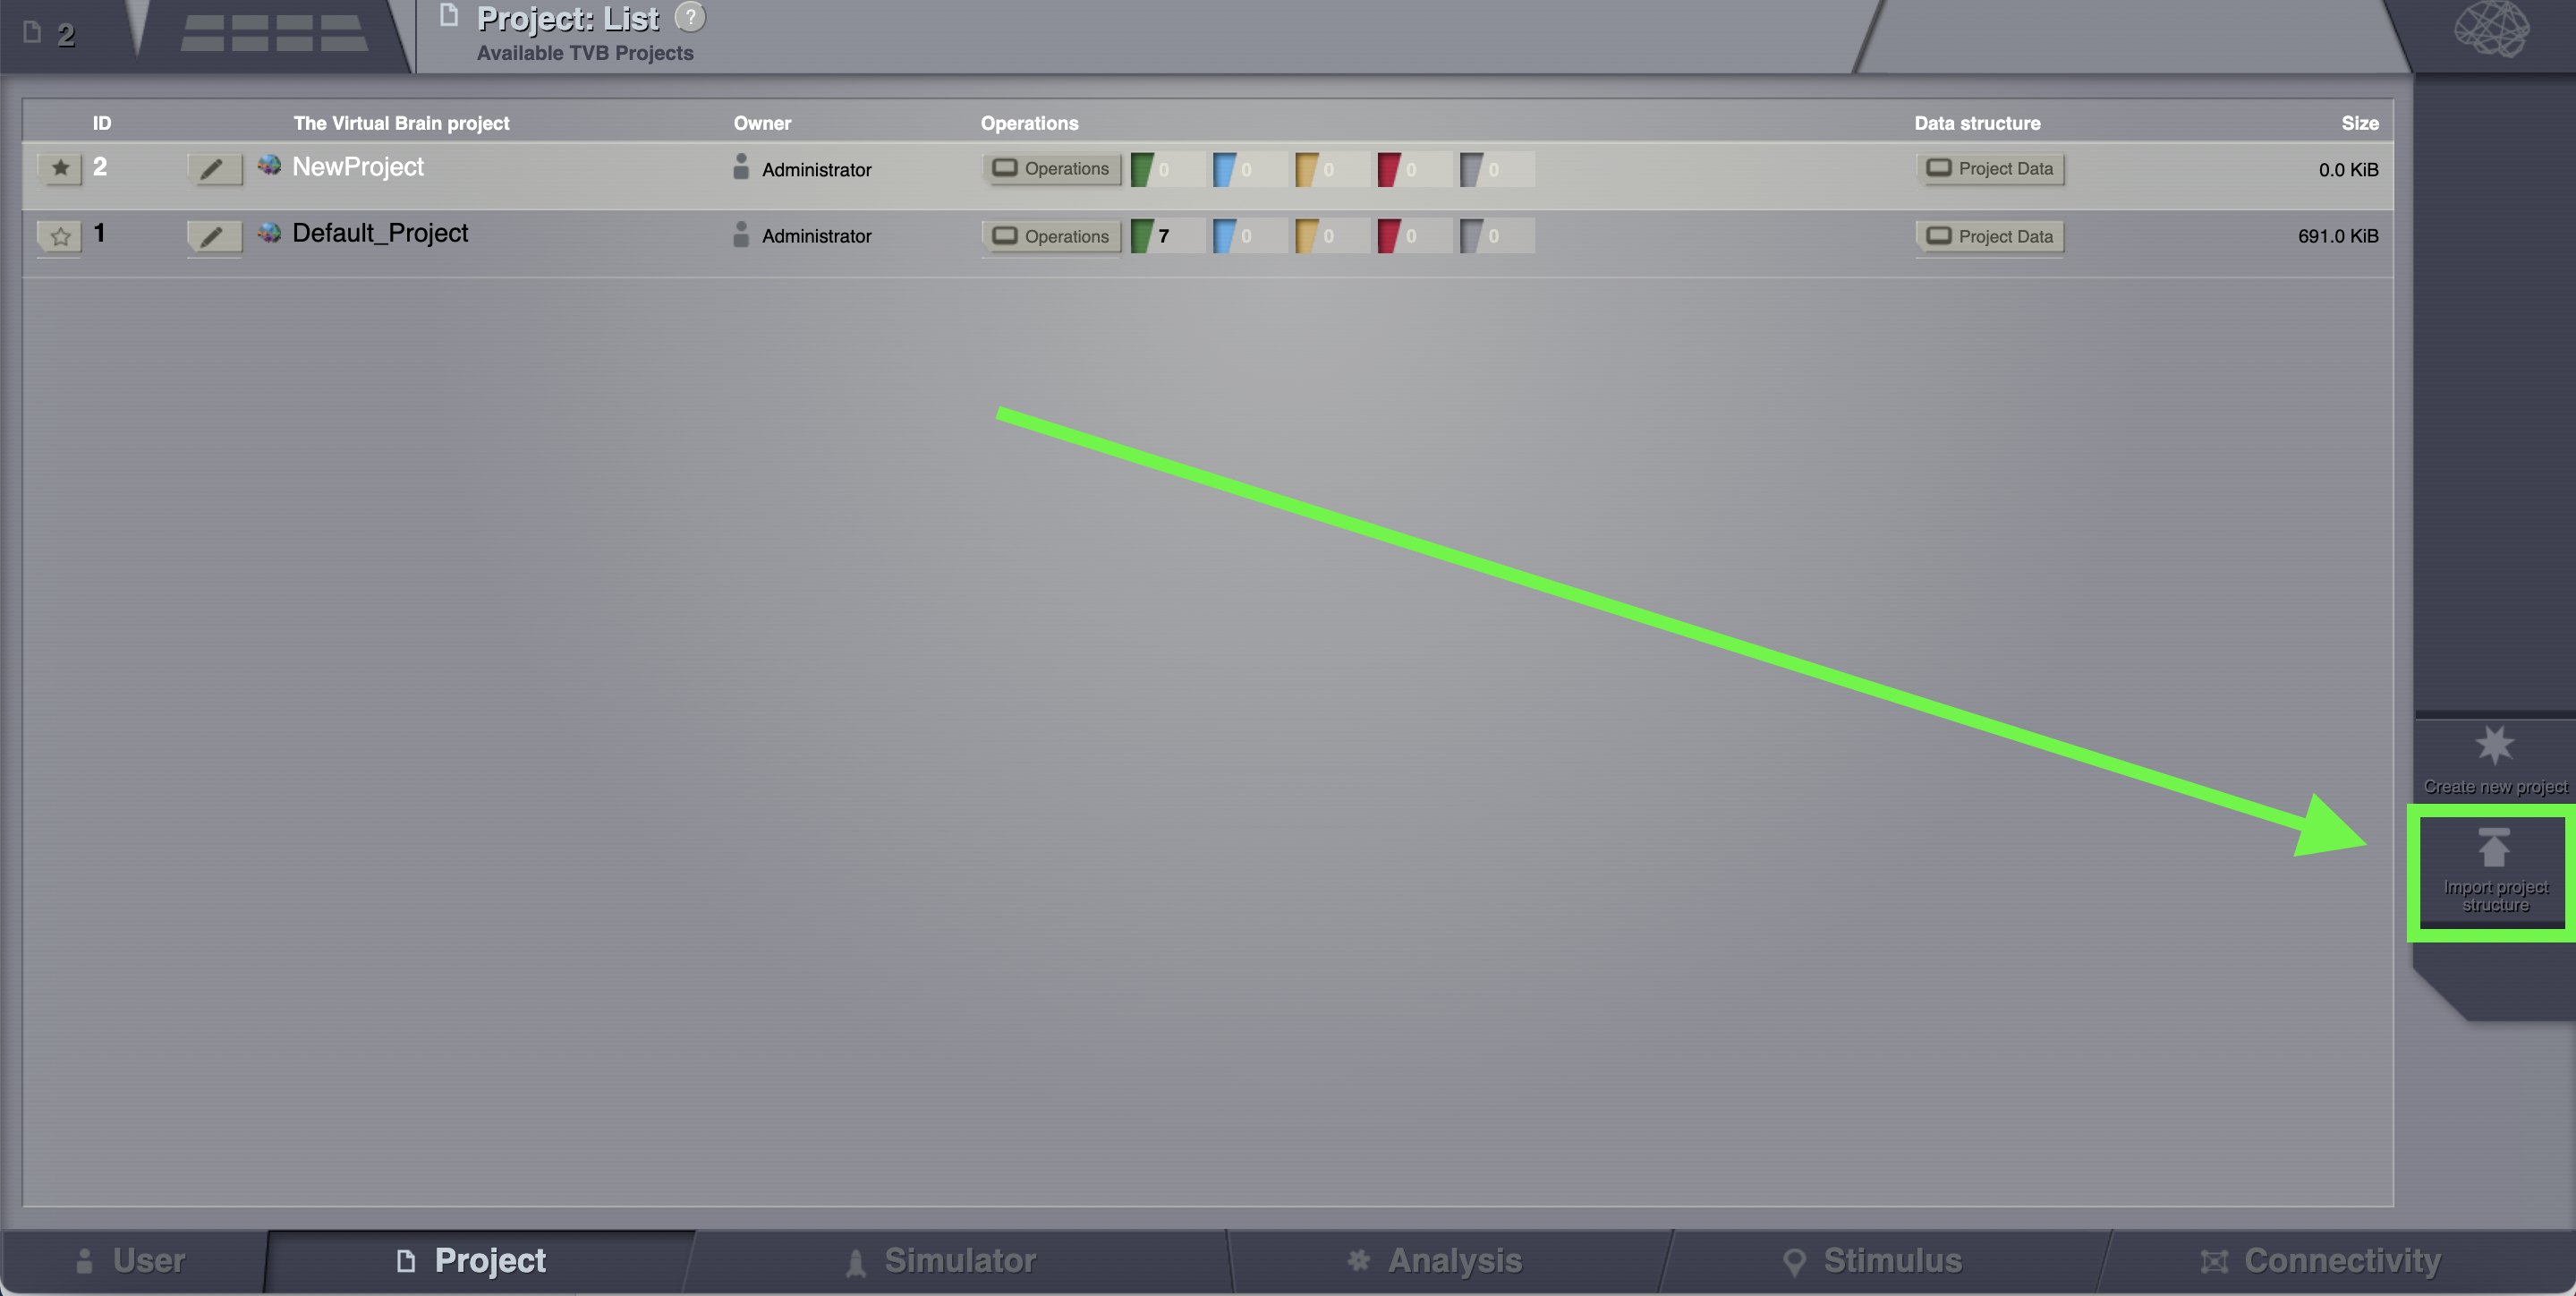
If you wish to import a project, on the right column, bottom corner, click on Import project structure.
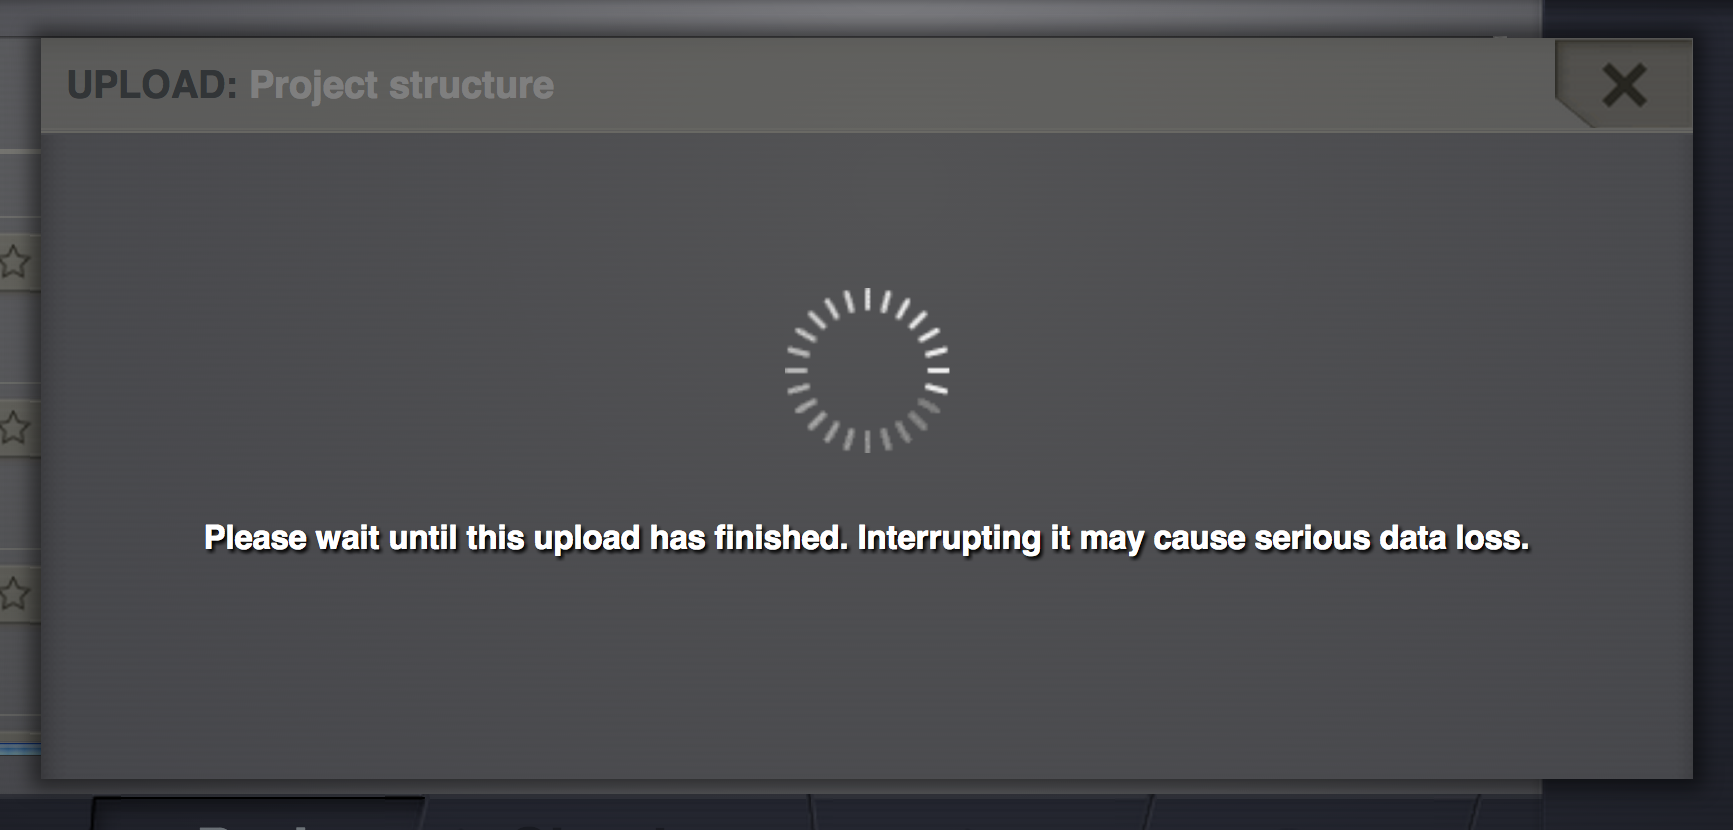
Chosing the ModelingEpilepsy.zip project and then Click on Upload.
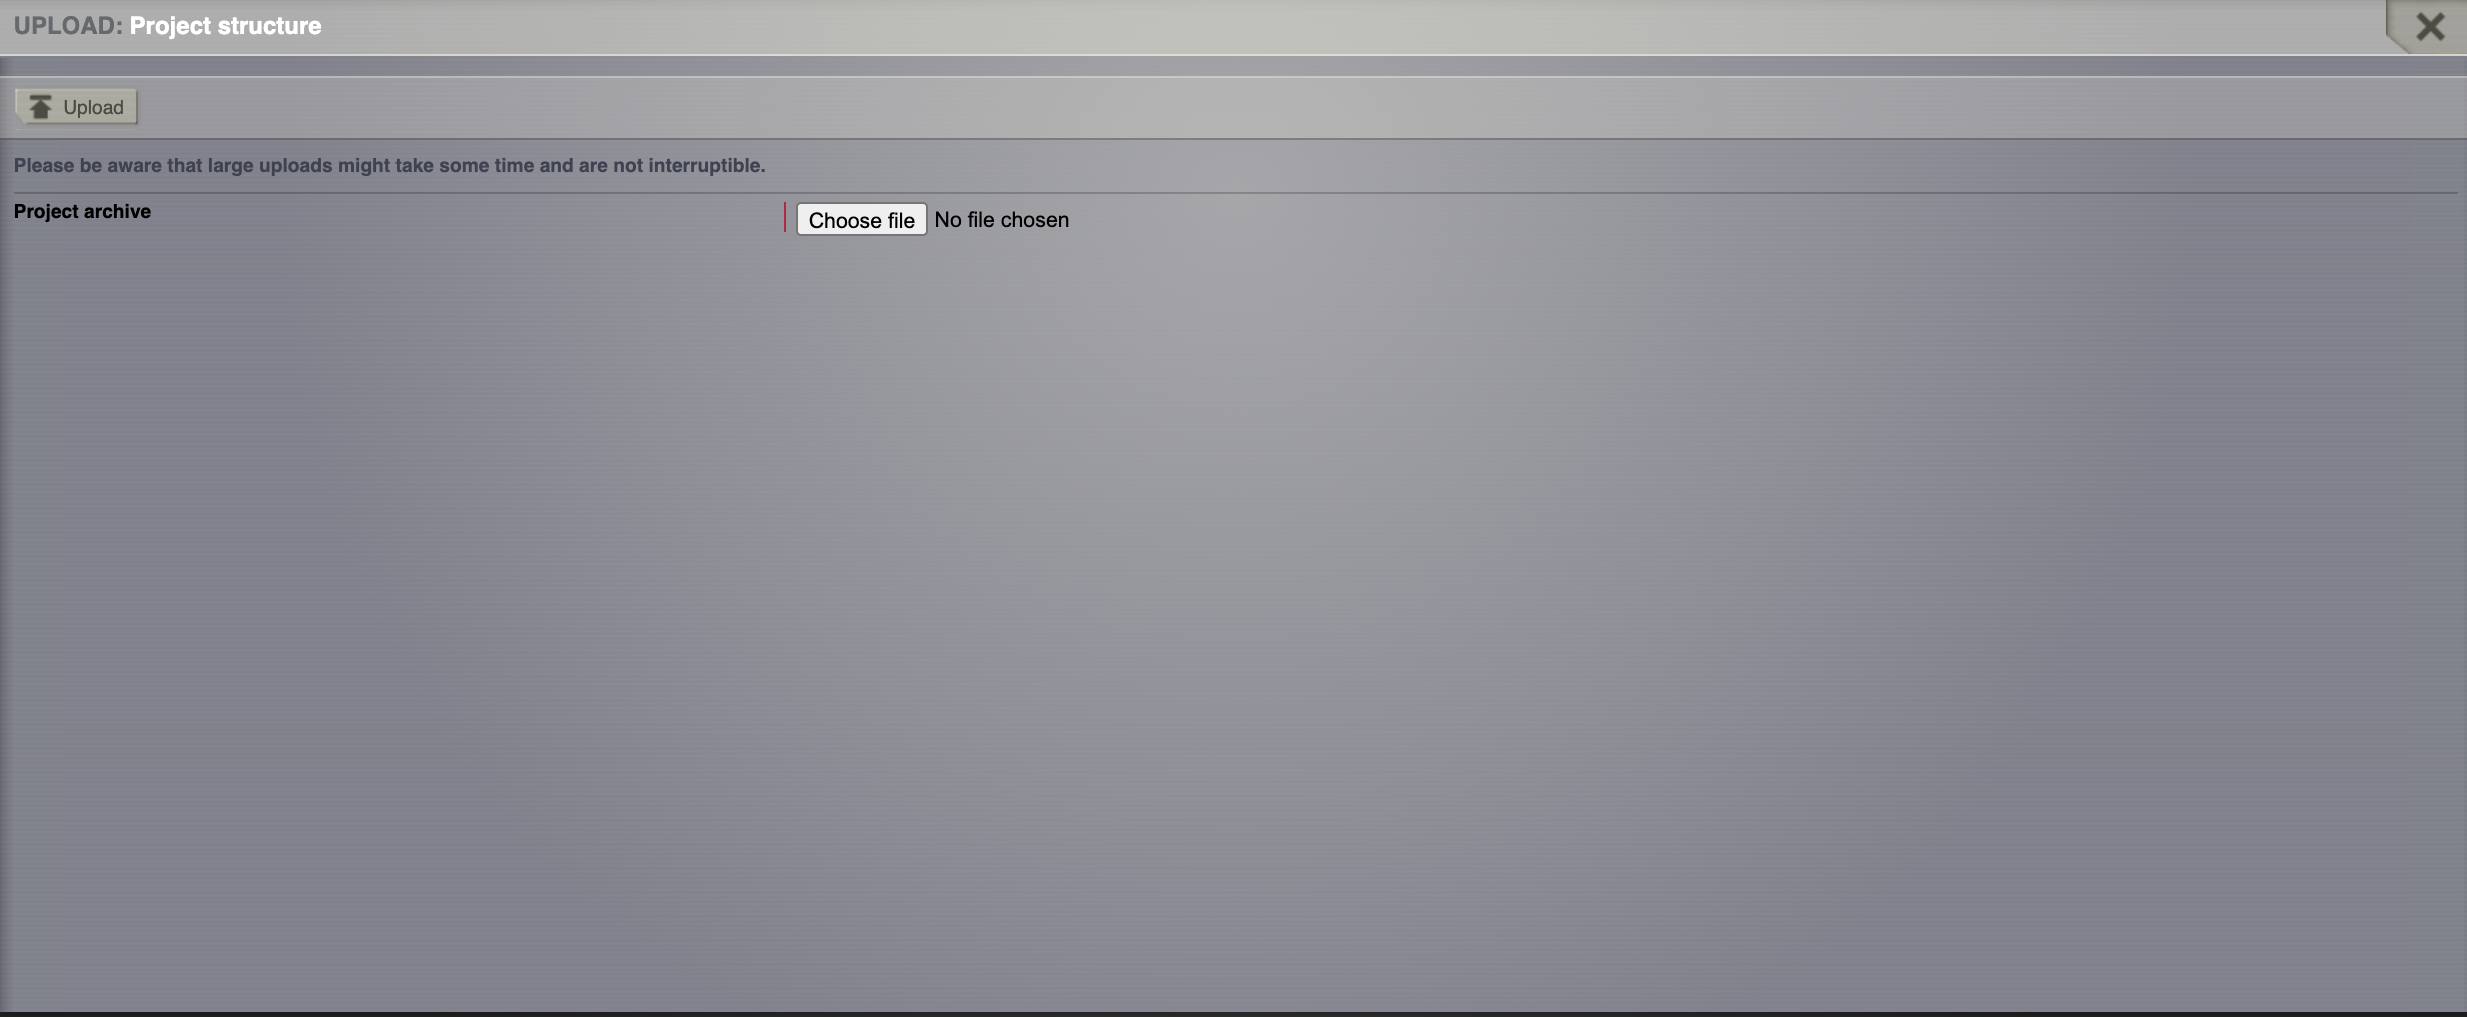
Be patient.
You can now see the project on the List of all projects.
If you wish to export a project, click on the pencil icon located left to the project name.
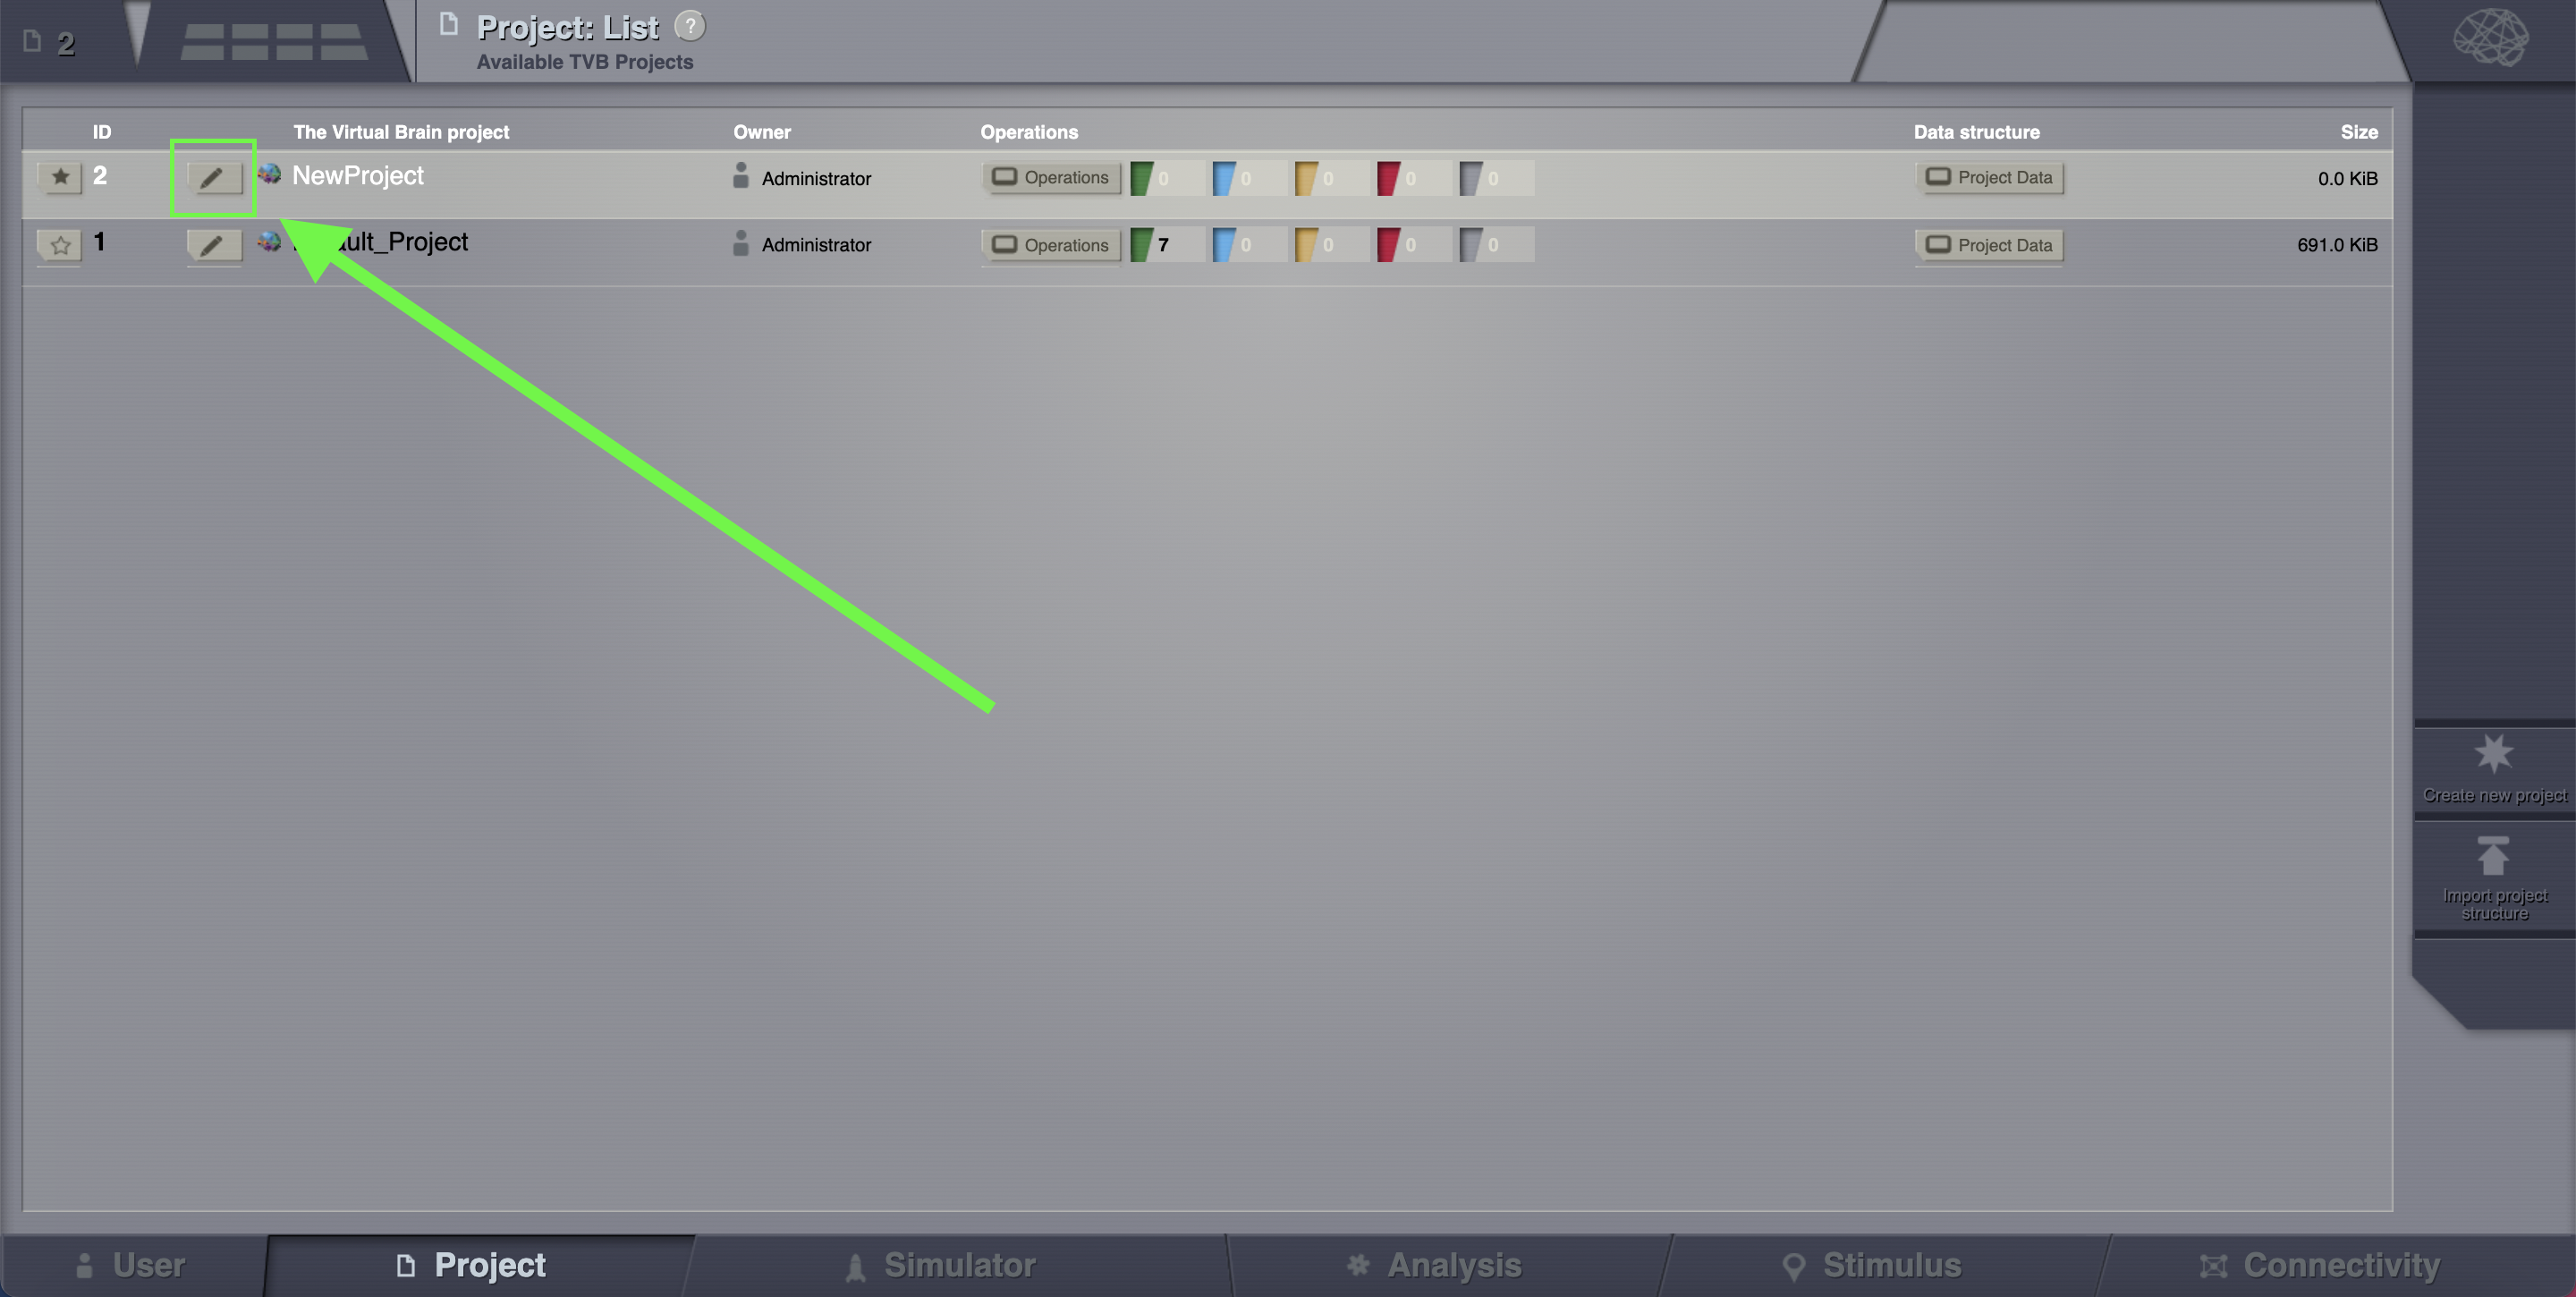
Clicking on it will open the Properties page of the project. Click on the Export Project button.
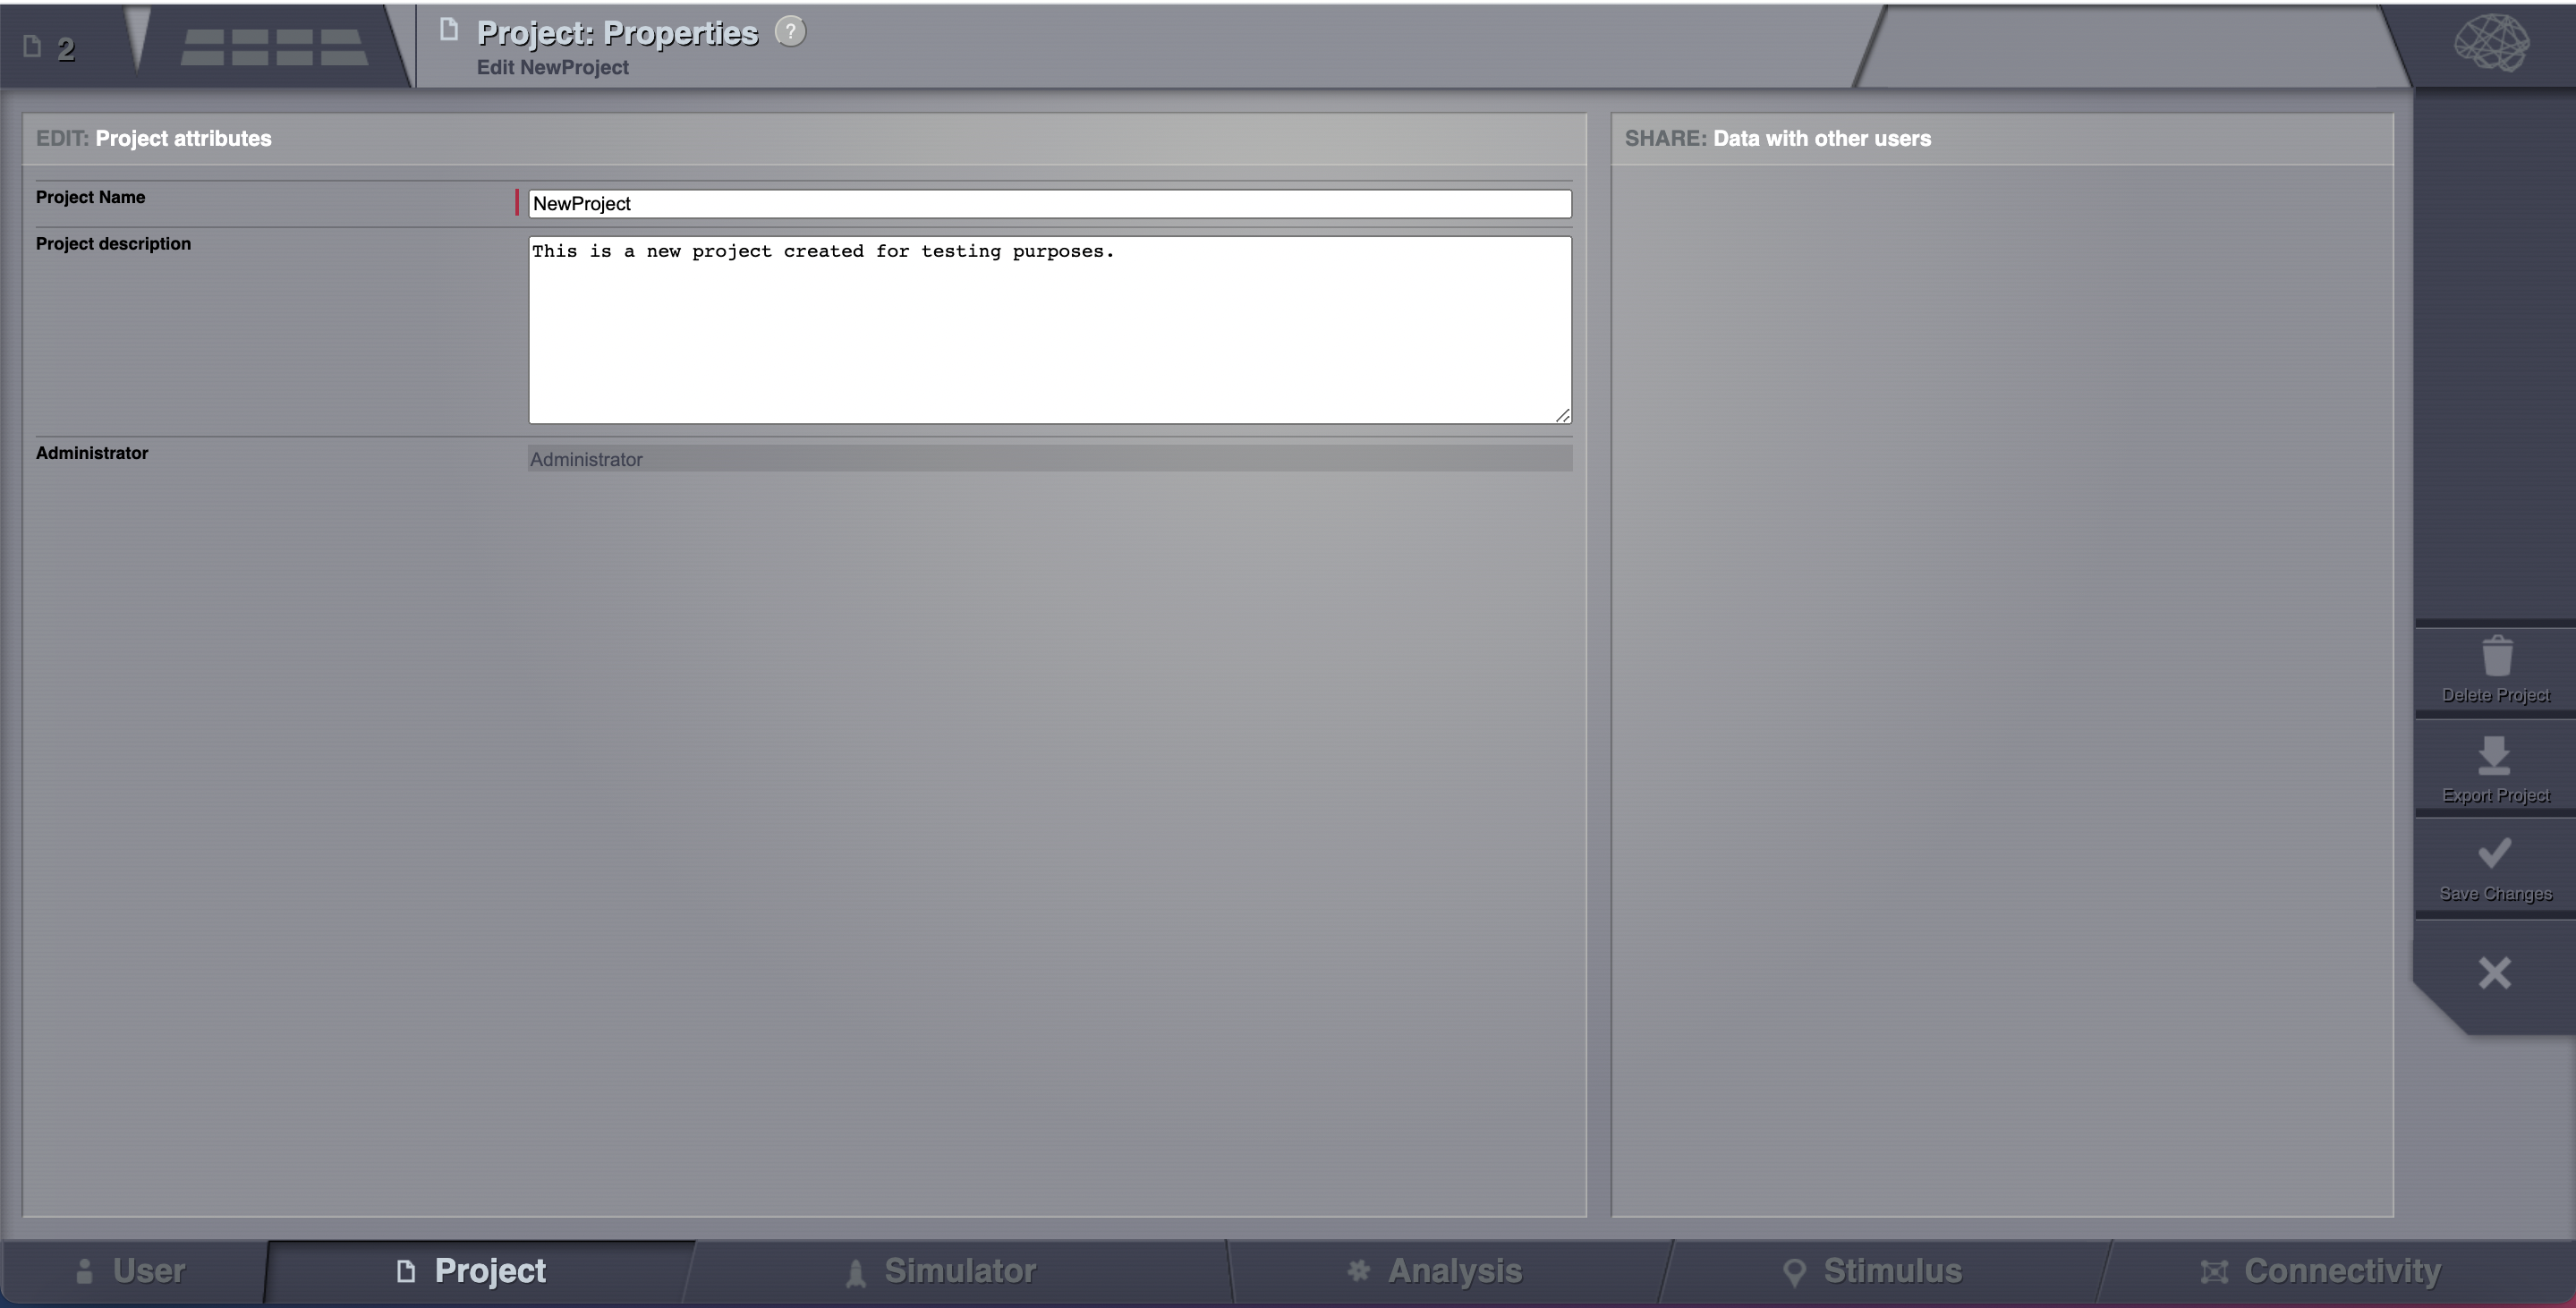
If you wish to delete a project, you click on the Delete button and the project will disappear from the list.
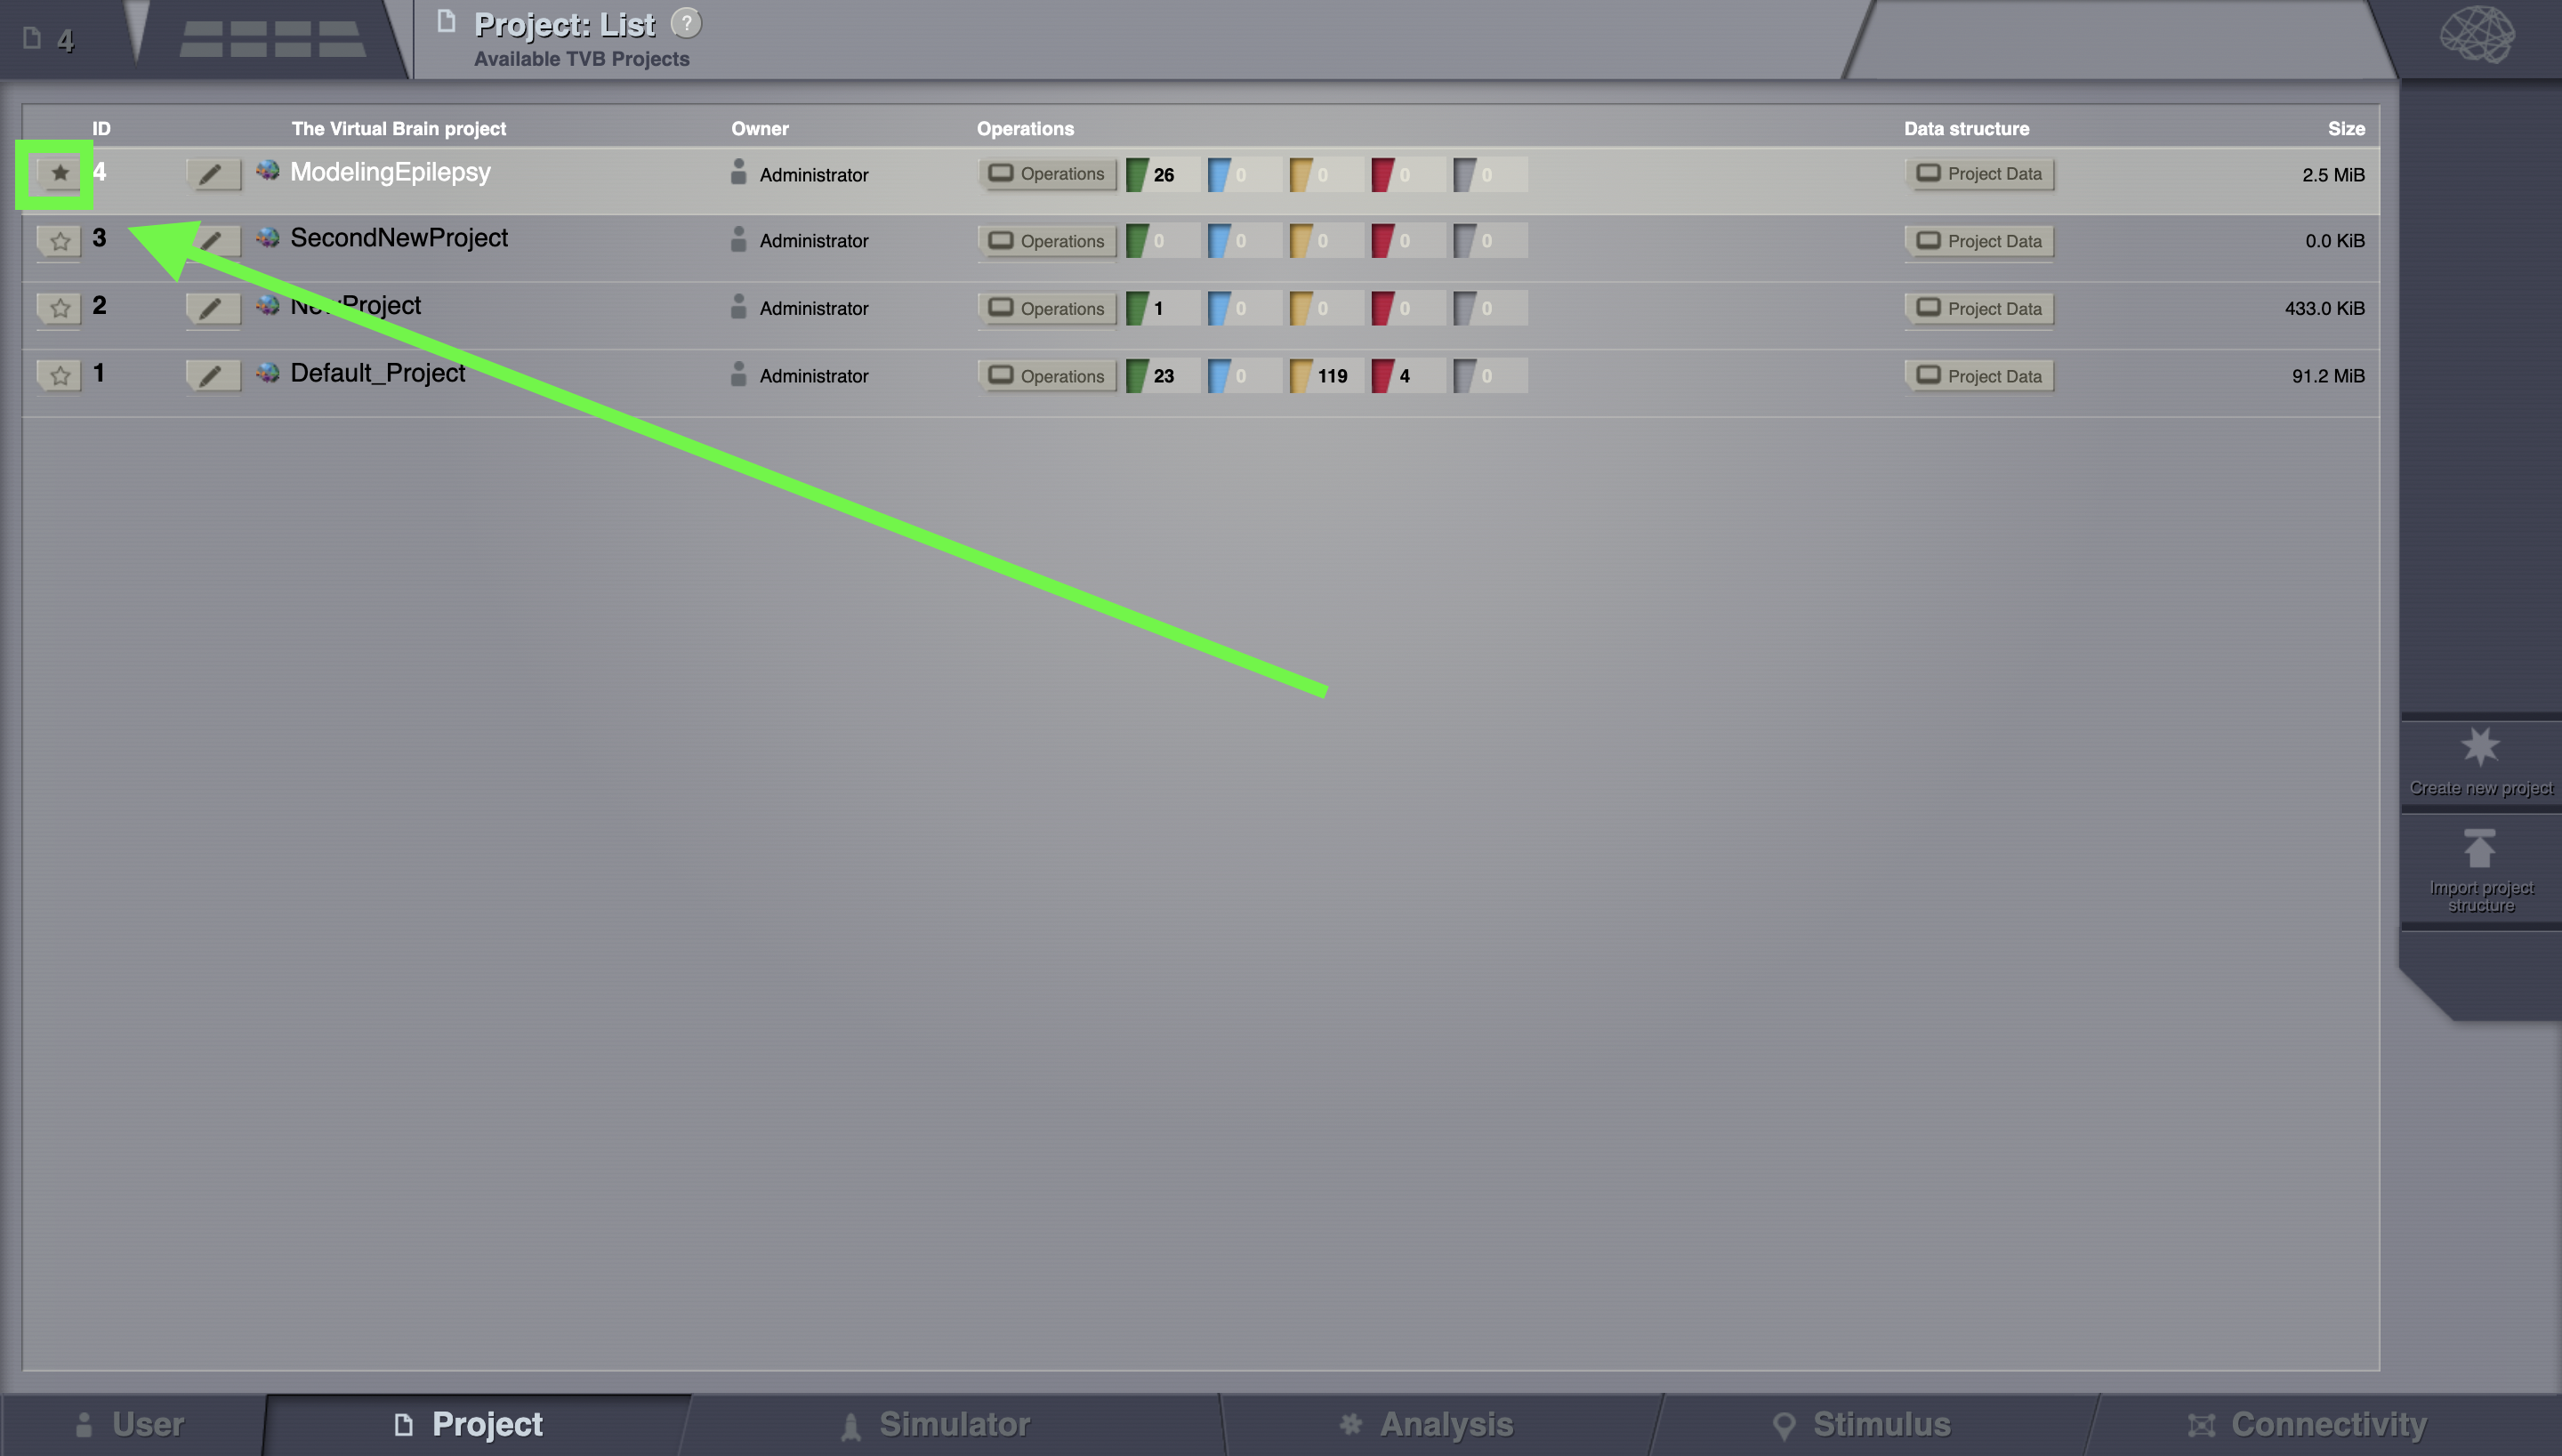
Select one of the projects (e.g. ModelingEpilepsy.zip). You select a project by clicking on the star icon.
Importing A Connectivity
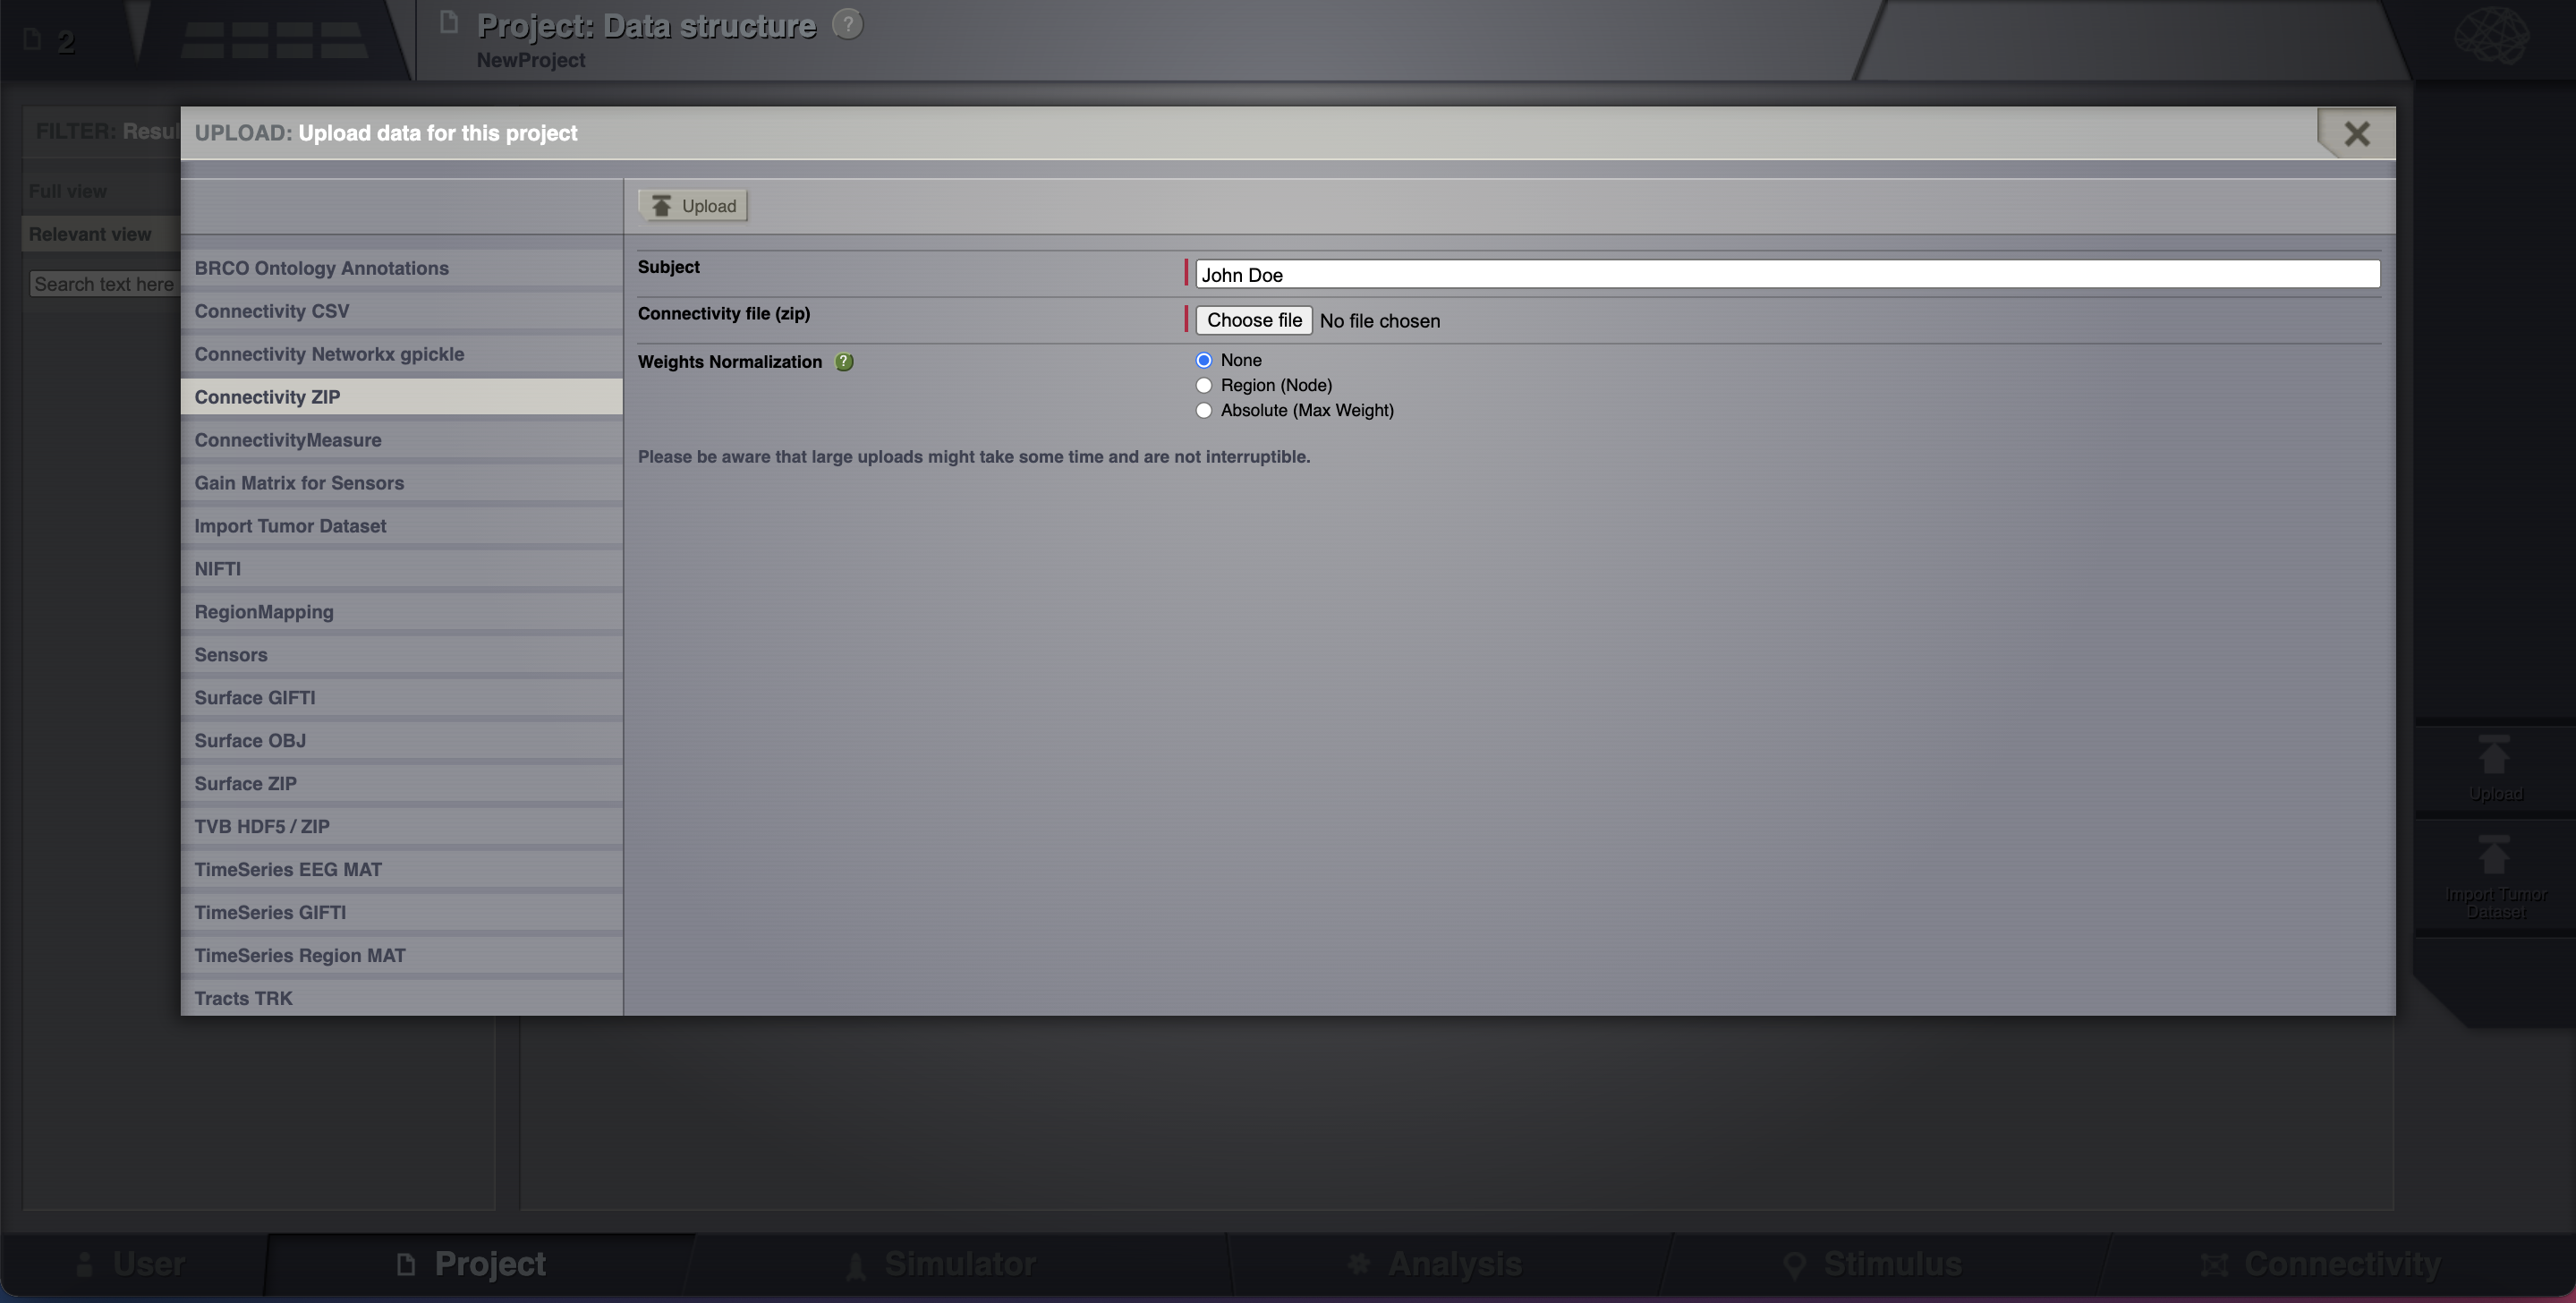
Assuming that you are working in the previously created project, upload a Connectivity in a zip file. Go to Projects > Data structure. Click on Upload. An overlay with the current supported formats will appear.
Select Connectivity ZIP.
From your downloaded tvb-data folder select the file connectivity_96.zip found at tvb_data/connectivity/.
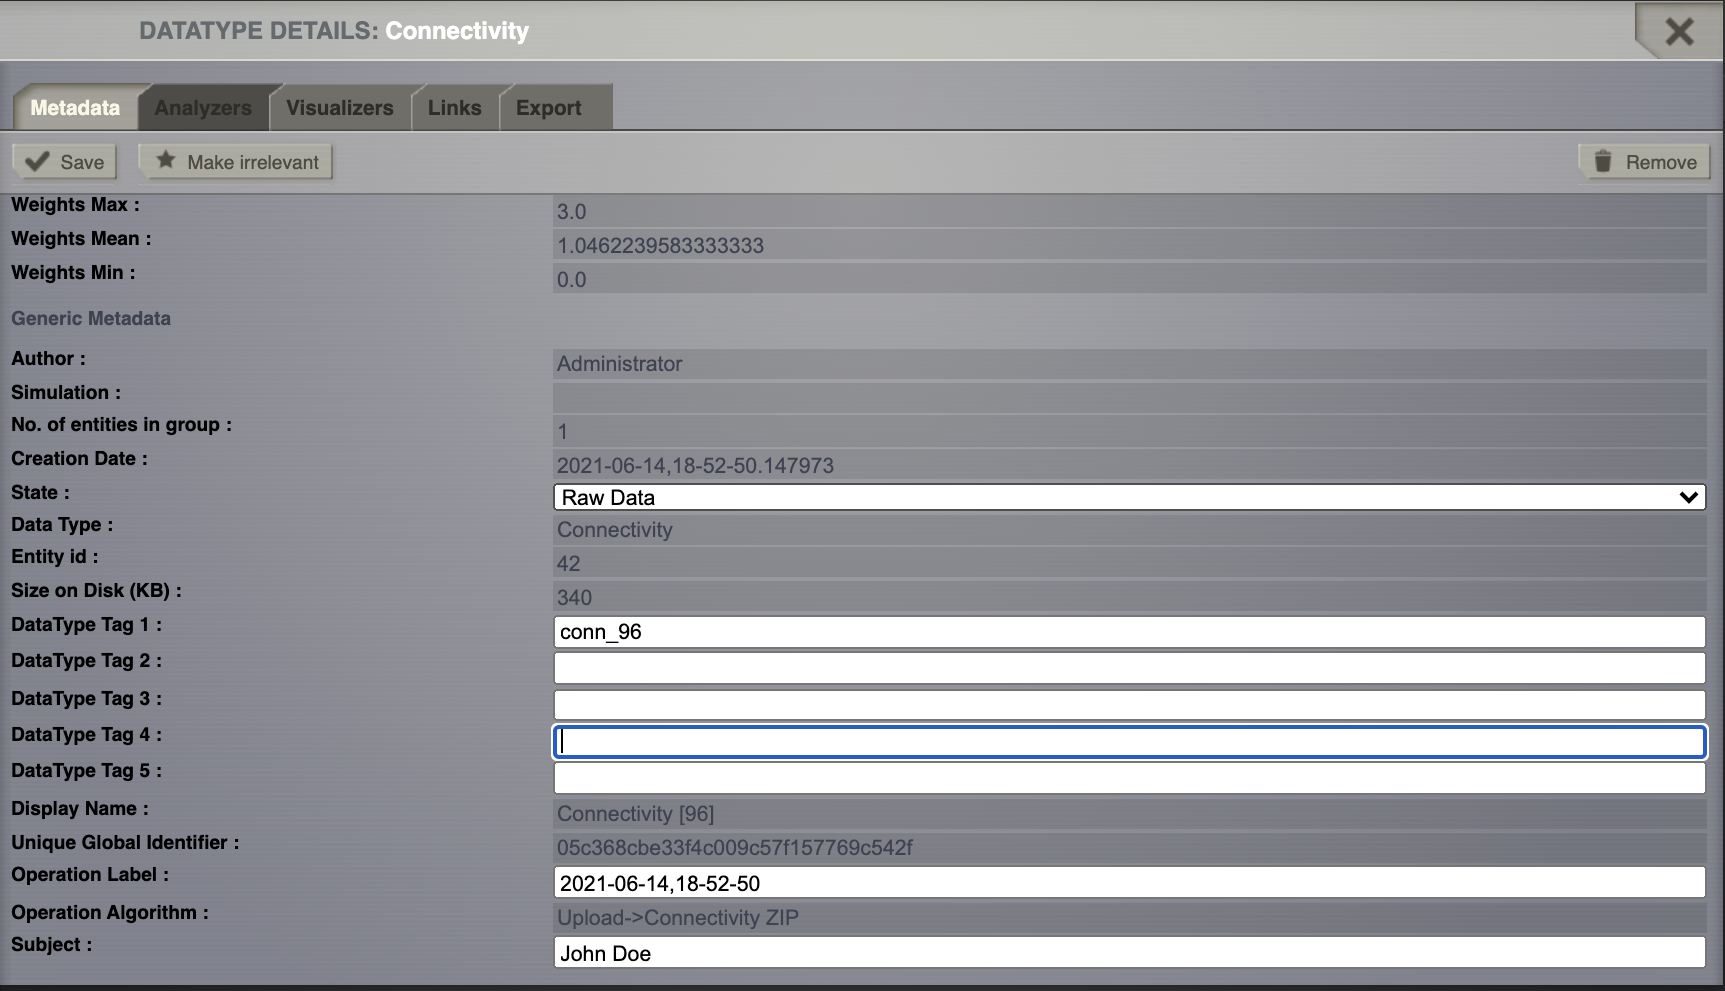
Add a personalized tag to this newly created datatype (e.g. conn_96).
Save the changes.
Link And Share
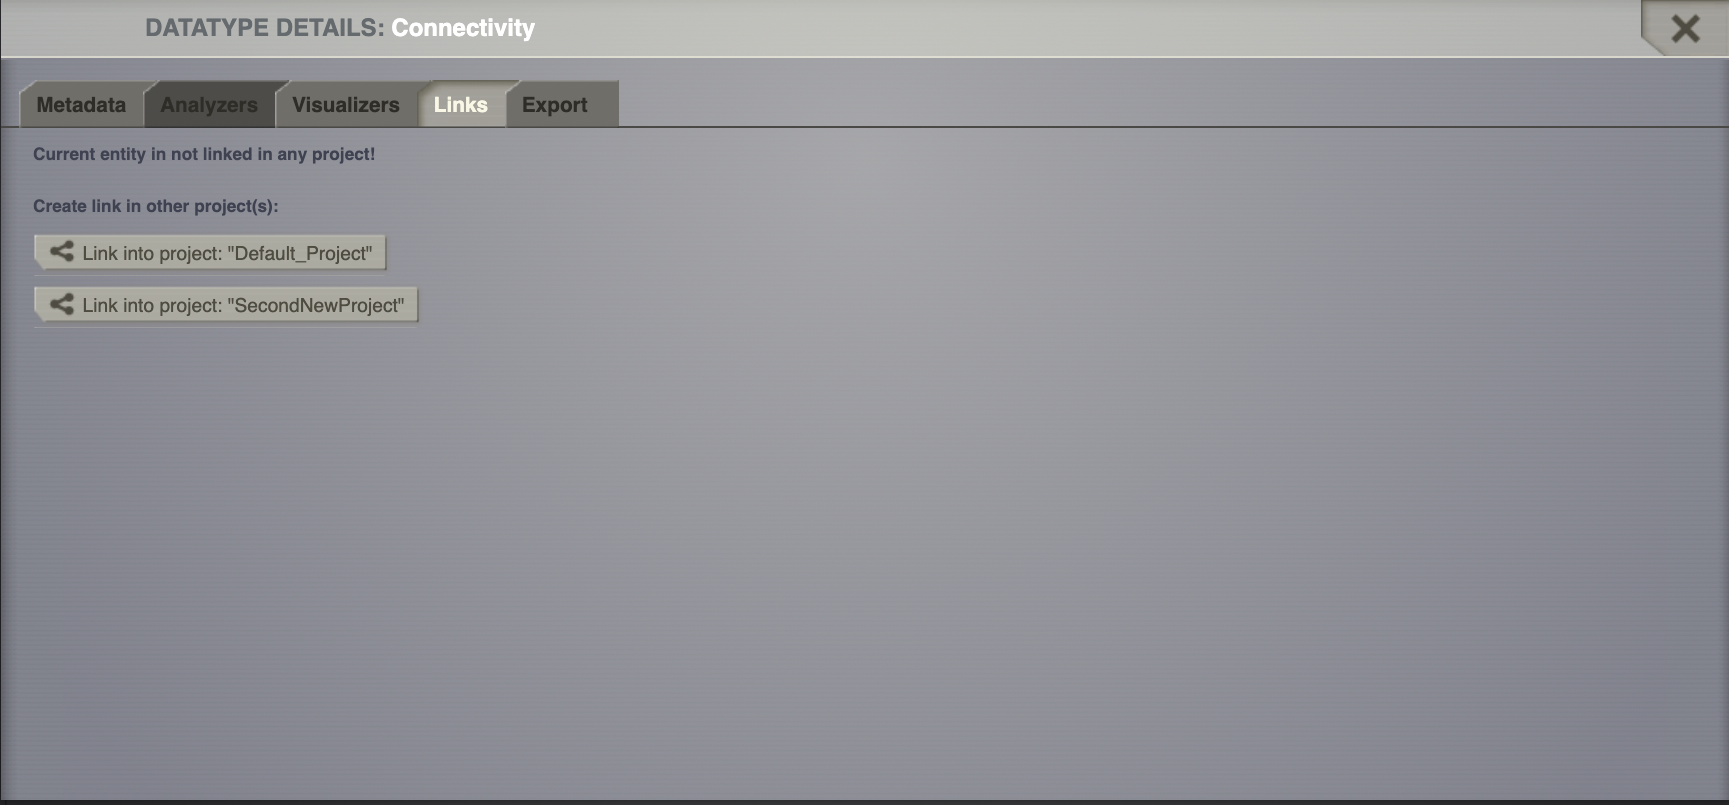
Select the connectivity you want to share.
In the metadata overlay, go to the tab Links. You’ll see a list with all your projects except the current one.
Link this datatype (connectivity) with SecondNewProject.
Go to Project > List of all projects.
Switch to SecondNewProject.
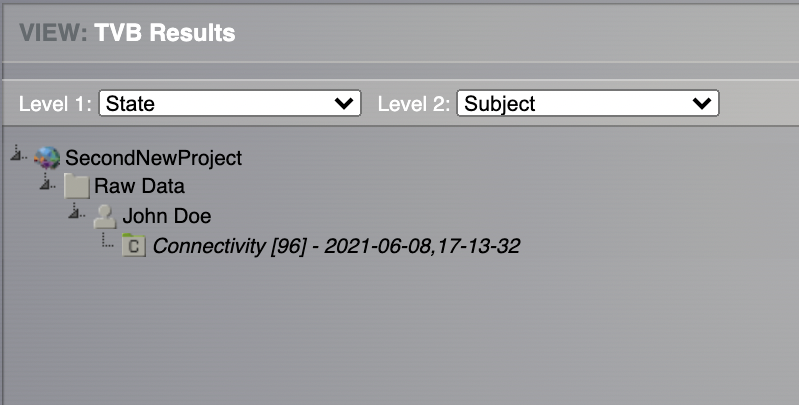
Then at Project > Data Structure you should see the datatype (connectivity) that you shared (the name is written in italics).
Go to Project > List of all projects.
Switch to ModelingEpilepsy.
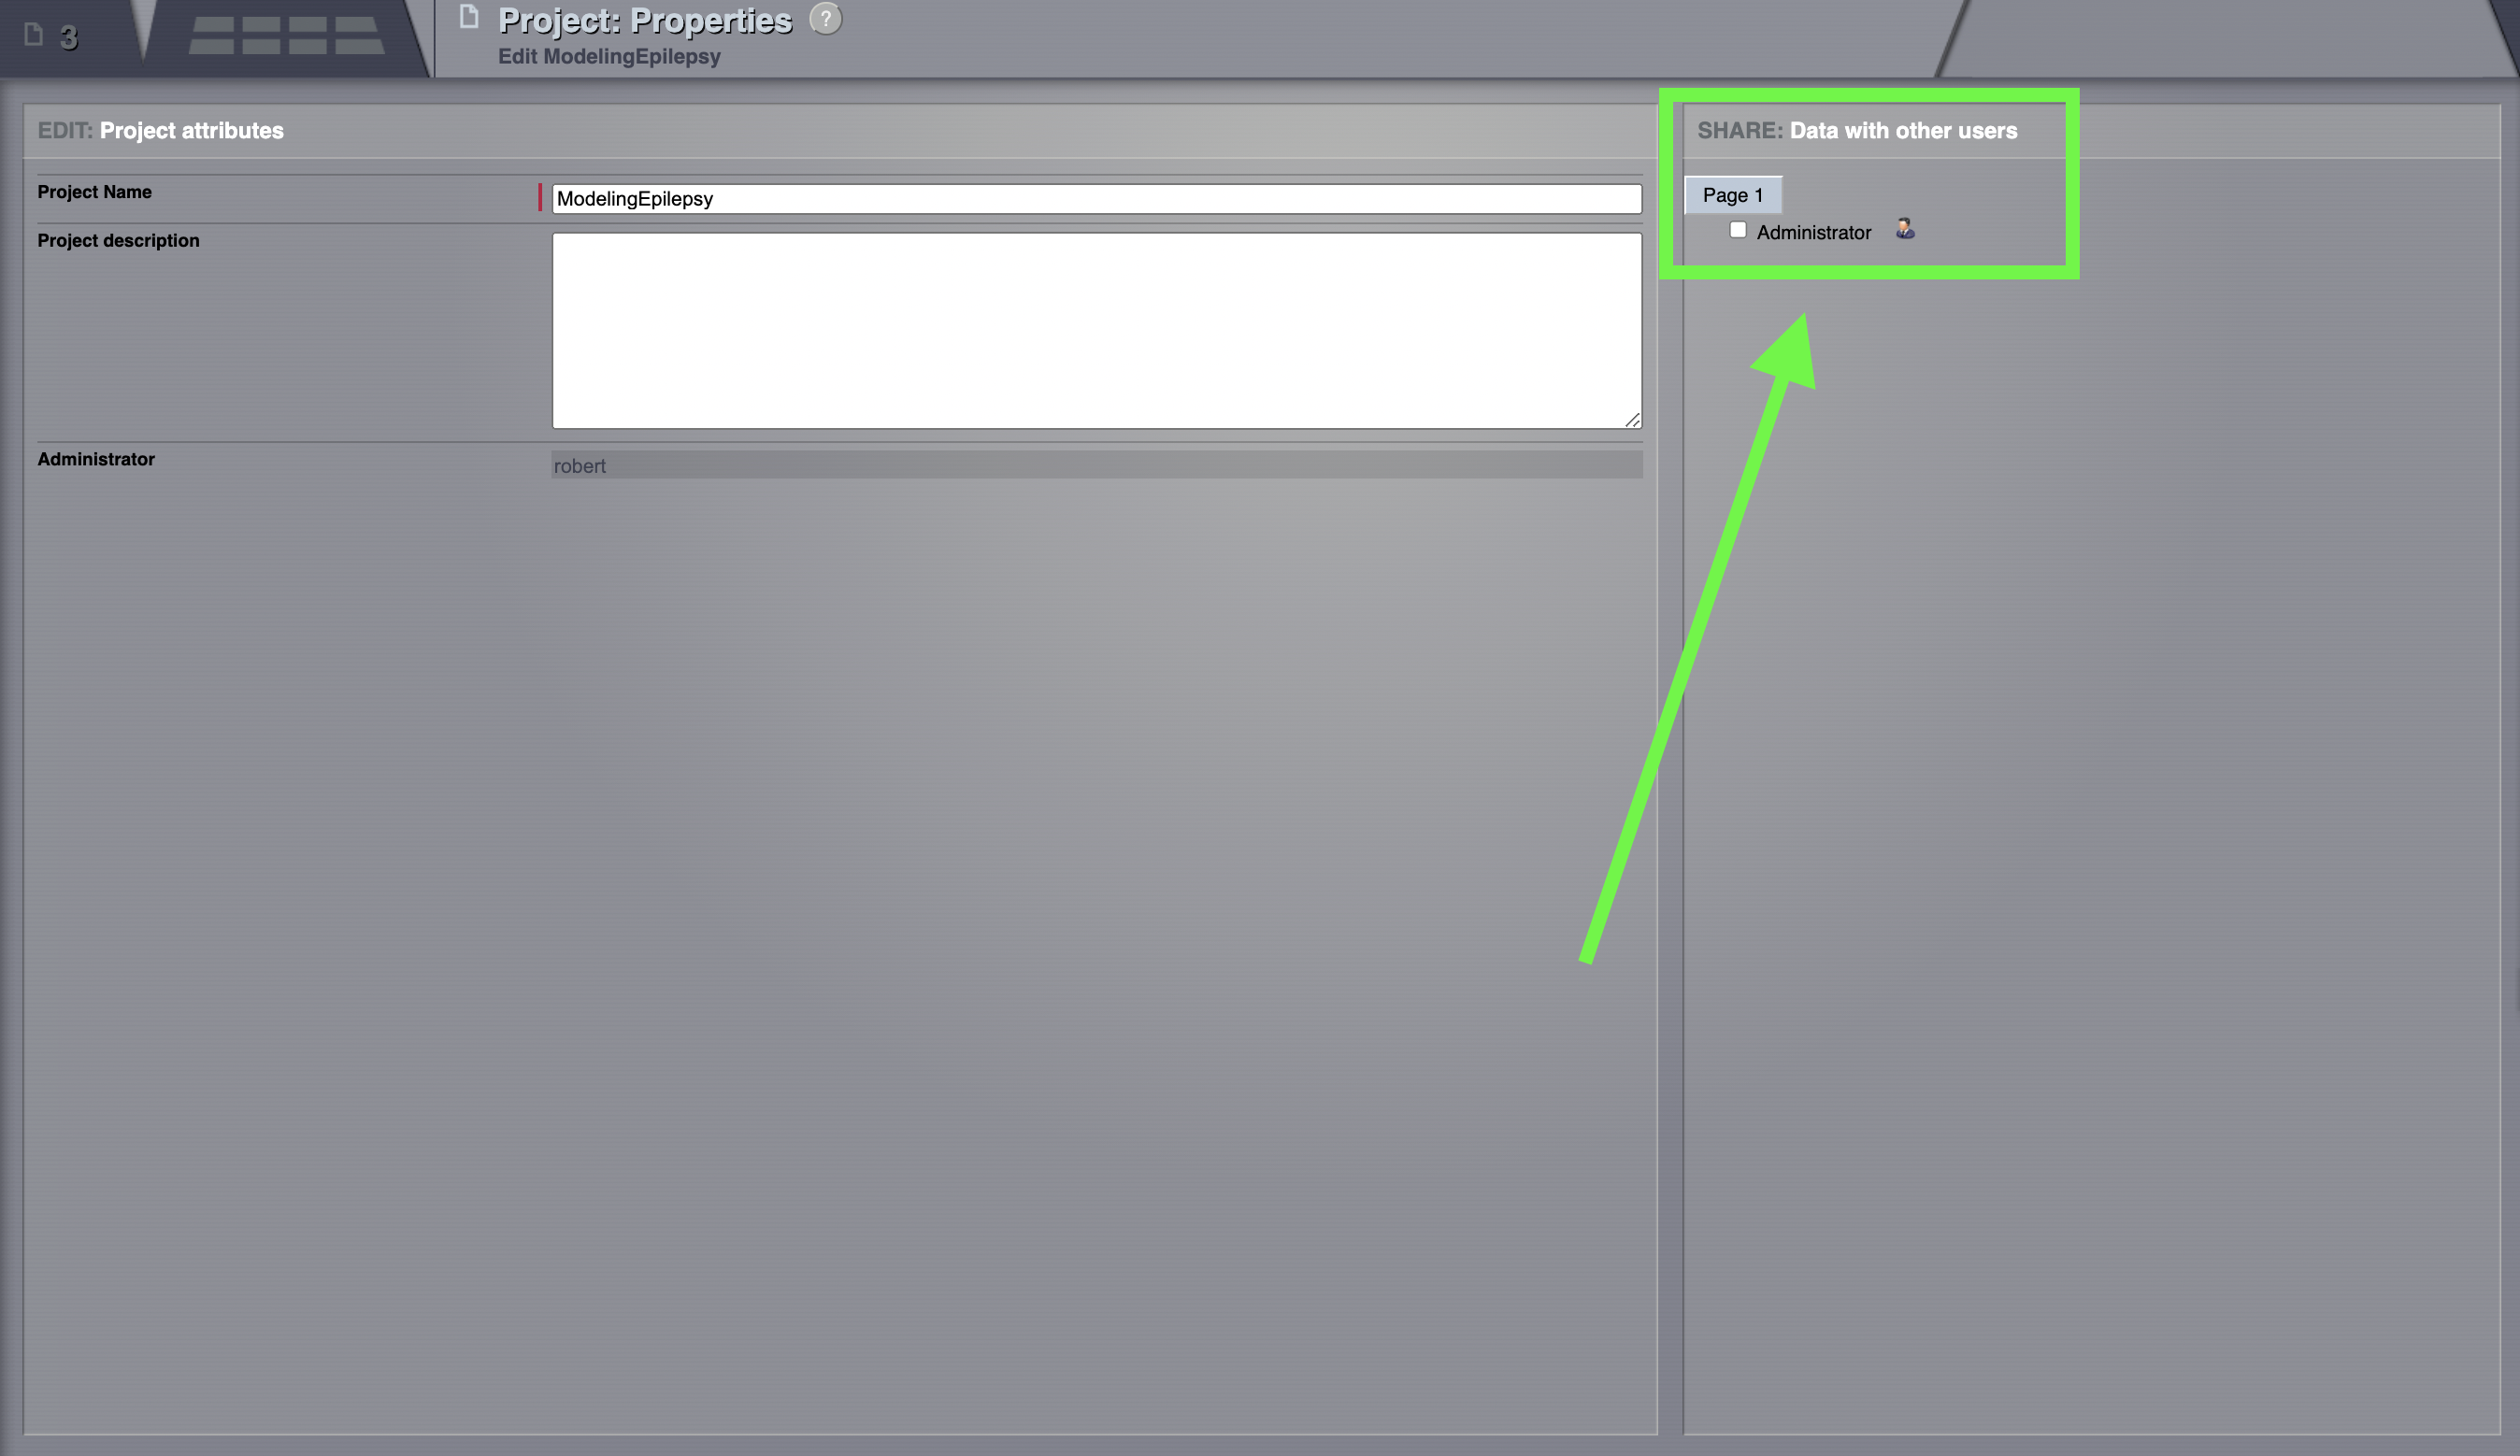
Then from Project > Basic properties share this project with the other user account.
Logout from your account and login with the other user.
You should be able to see the ModelingEpilepsy project in your other account as well.
Export and Read a Datatype
Select ModelingEpilepsy as your current project.
Go to Project > Data structure
Click on
 from TimeSeriesRegion.
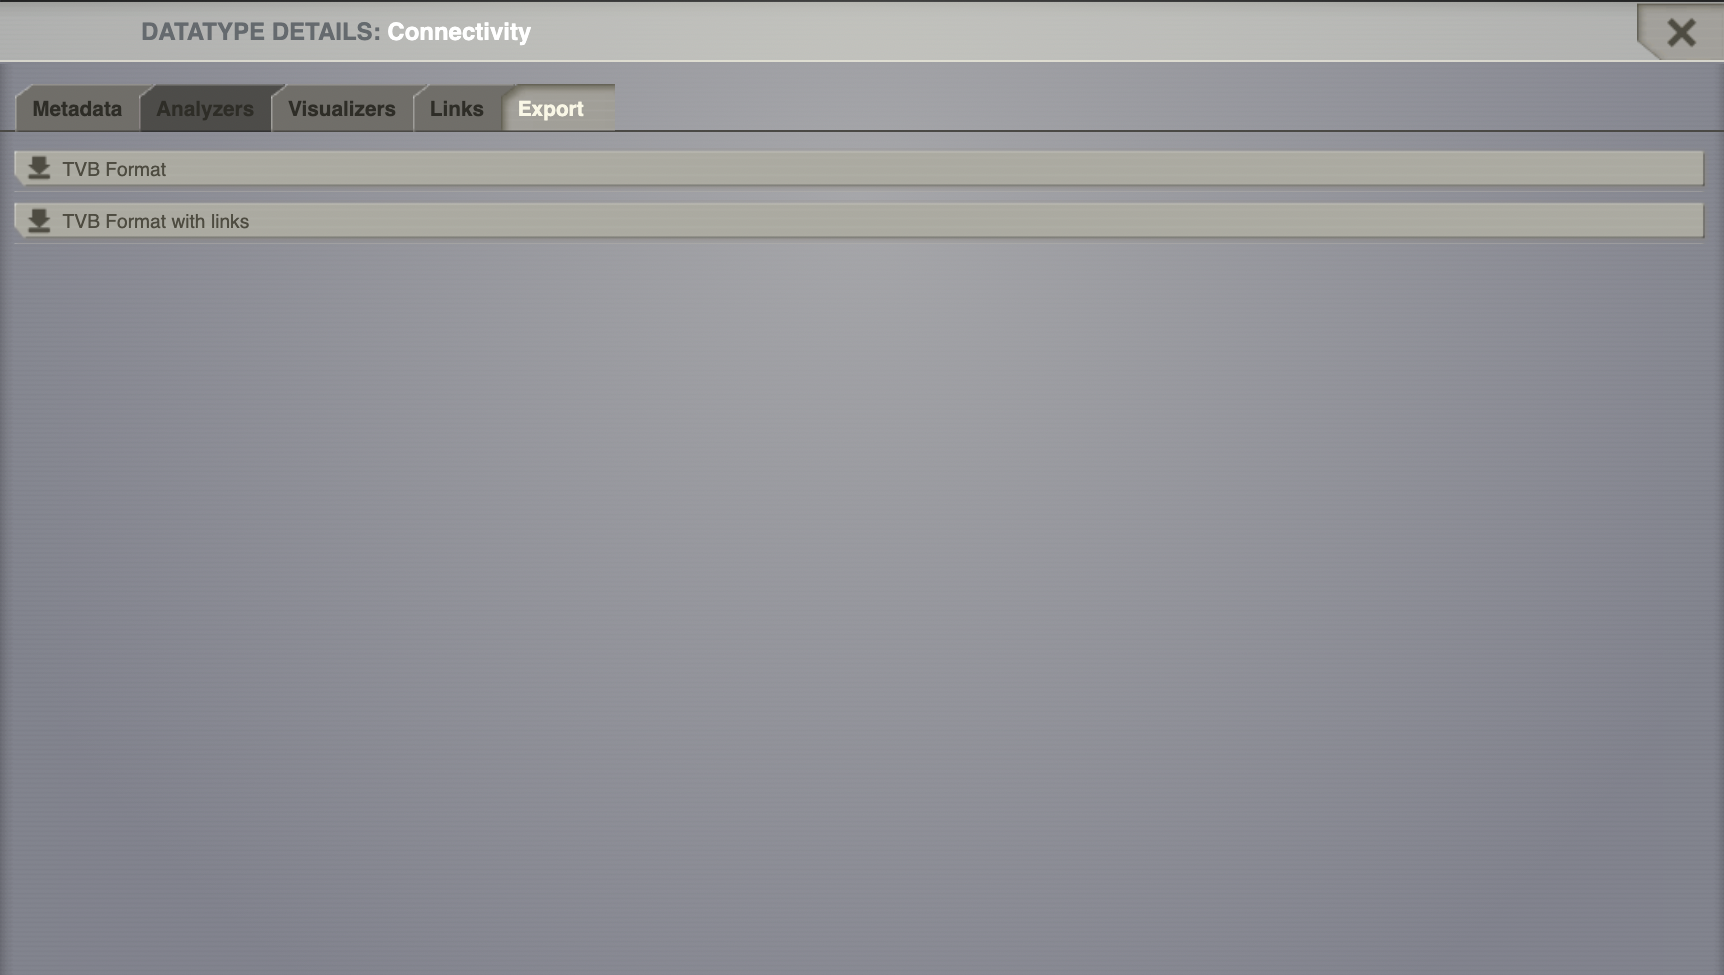
From the overlay, Export tab, download only the time series h5 file by clicking on TVB format (h5).
If you wish to download not just the time series file, but the linked datatypes as well, choose the TVB Format with links option.
Rename the file if you want (e.g. LinkAndShare_TimeSeriesRegion).
From an ipython shell you can follow the commands presented below. You can also use a ipython notebook by going into TVB_Distribution/bin/ and start the jupyter_notebook script.
In [1]: import h5py
In [2]: import matplotlib.pyplot as plt
In [3]: f = h5py.File('LinkAndShare_TimeSeriesRegion.h5', 'r')
In [4]: f.keys()
Out[4]: <KeysViewHDF5 ['data', 'time']>
In [5]: f.attrs.keys()
Out[5]:
<KeysViewHDF5 [
'TVB_Data_version',
'TVB_connectivity',
'TVB_create_date',
'TVB_gid',
'TVB_invalid',
'TVB_is_nan',
'TVB_labels_dimensions',
'TVB_nr_dimensions',
'TVB_operation_tag',
'TVB_region_mapping',
'TVB_sample_period',
'TVB_sample_period_unit',
'TVB_sample_rate',
'TVB_start_time',
'TVB_state',
'TVB_subject',
'TVB_title',
'TVB_user_tag_1',
'TVB_user_tag_2',
'TVB_user_tag_3',
'TVB_user_tag_4',
'TVB_user_tag_5',
'TVB_visible',
'TVB_written_by']>
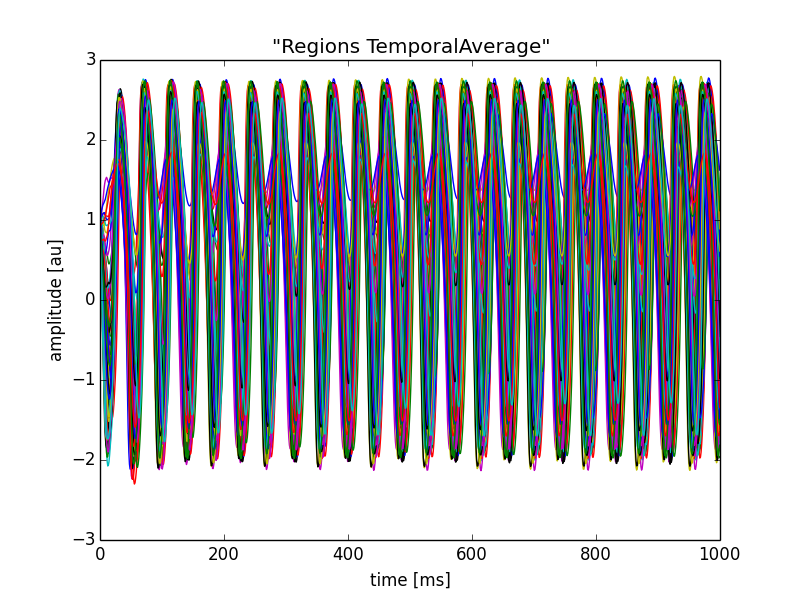
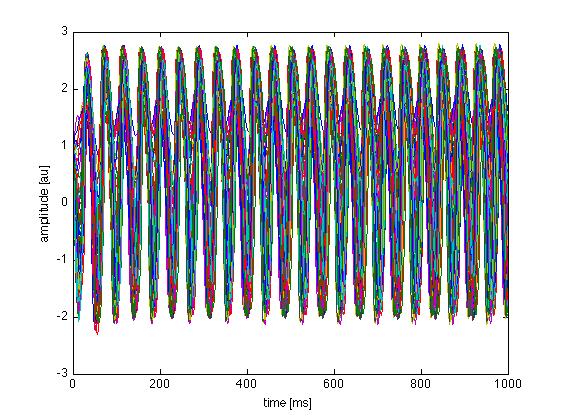
In[6]: plt.plot(f['time'], f['data'][:, 0, :, 0])
plt.xlabel('time [ms]')
plt.ylabel('amplitude [au]')
plt.title(f.attrs['TVB_Title'])
Out[6]: <matplotlib.text.Text at 0x118eb0ad0>
In Matlab :
>> hinfo = hdf5info('LinkAndShare_TimeSeriesRegion.h5');
>> hinfo.GroupHierarchy.Datasets.Name
ans =
/data
ans =
/time
>> hinfo.GroupHierarchy.Attributes.Name
...
>> data = hdf5read(hinfo.GroupHierarchy.Datasets(1));
>> time = hdf5read(hinfo.GroupHierarchy.Datasets(2));
>> plot(time, squeeze(data))
>> xlabel('time [ms]')
>> ylabel('amplitude [au]')
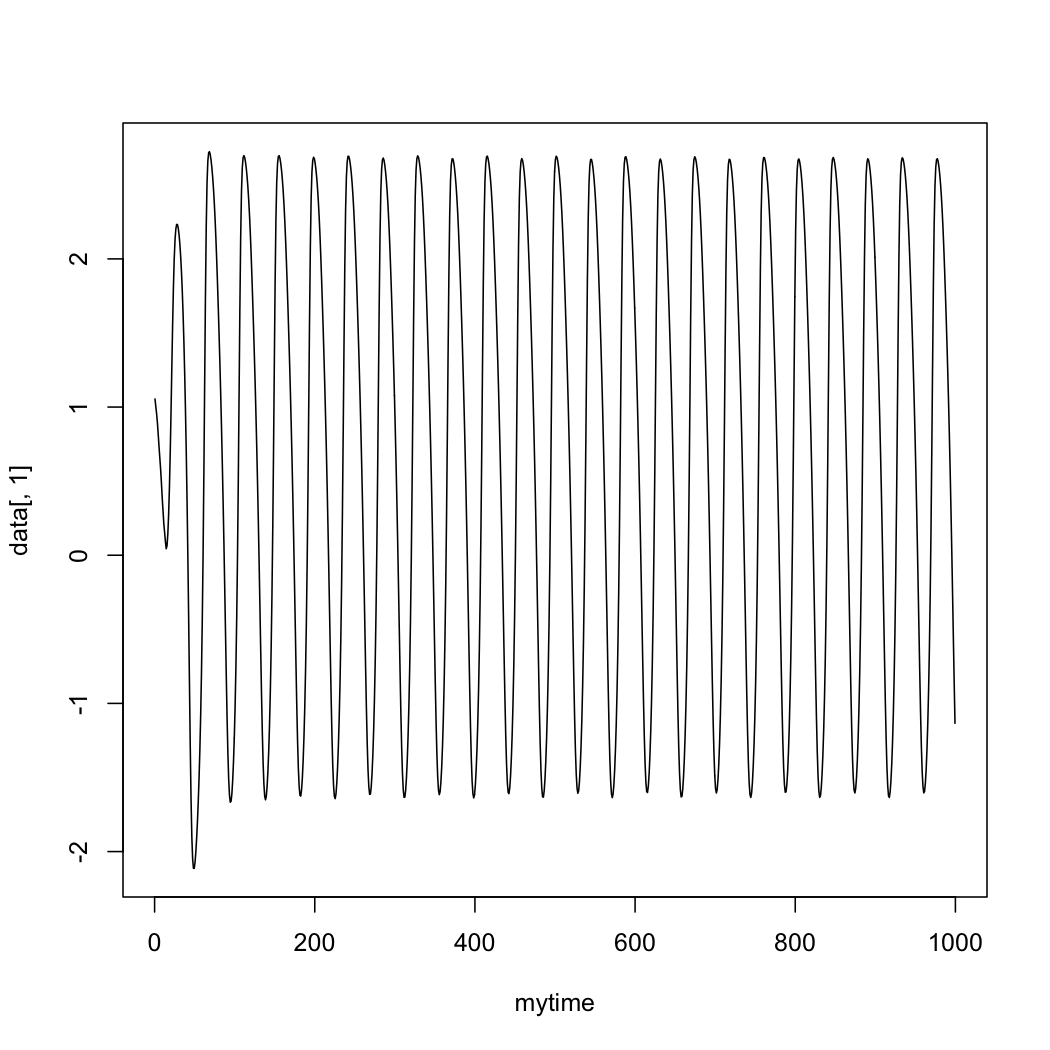
In R:
> data <- h5read("/Users/paupau/GithubProjects/tvb-handbook/
tvbworkshop/LinkAndShare_TimeSeriesRegion.h5", "data")

> time <- h5read("/Users/paupau/GithubProjects/tvb-handbook/
tvbworkshop/LinkAndShare_TimeSeriesRegion.h5", "time")

> data = drop(mydata)

> plot(mytime, data[,1], type="l")
More Documentation
Online help is available clicking on the  icons next to each
entry. For more documentation on The Virtual Brain platform, please see
Sanz_Leon_et_al, Woodman_et_al.
icons next to each
entry. For more documentation on The Virtual Brain platform, please see
Sanz_Leon_et_al, Woodman_et_al.
Support
The official TVB website is www.thevirtualbrain.org. All the documentation and tutorials are hosted on docs.thevirtualbrain.org. You’ll find our public repository at https://github.com/the-virtual-brain. For questions and bug reports we have a users group https://groups.google.com/forum/#!forum/tvb-users
Sanz-Leon P, Knock SA,, Woodman MM, Domide L, Mersmann J, McIntosh AR, Jirsa VK. The virtual brain: a simulator of primate brain network dynamics. Frontiers in Neuroinformatics, 7:10, 2013.
Woodman MM, Pezard L, Domide L, Knock SA, Salz-Leon P, McIntosh AR, Mersmann J, Jirsa VK. Integrating neuroinformatics tools in the virtual brain. Frontiers in Neuroinformatics, 8:36, 2014