Two Epileptor simulation
In this demo, we show how to perform a simulation with two Epileptors.
Ensure TVB is set up
tvb_setup
[tvb_setup] using Python 2.7 C:UsersmwDownloadsTVB_Distributiontvb_datapython.exe
TVB modules available.
Build simulator
% Create epileptor model.
model = py.tvb.simulator.models.Epileptor();

% Difference coupling between nodes' coupling variables
coupling = py.tvb.simulator.coupling.Difference(pyargs('a', 1e-3));

% 2 nodes, random connection weights, zero tract lengths
conn = py.tvb.datatypes.connectivity.Connectivity();
conn.weights = py.numpy.random.rand(2, 2);
conn.tract_lengths = py.numpy.zeros([2 2]);

% Noise per state variable
noise = py.tvb.simulator.noise.Additive(...
    pyargs('nsig', py.numpy.array([0.003 0.003 0 0.003 0.003 0])));

% Monitor neural time series at 2 kHz
monitor = py.tvb.simulator.monitors.TemporalAverage(...
    pyargs('period', 0.5));

% Create simulator
sim = py.tvb.simulator.simulator.Simulator(pyargs(...
    'integrator', py.tvb.simulator.integrators.HeunStochastic(...
        pyargs('dt', 0.1, 'noise', noise)),...
    'model', model, ...
    'coupling', coupling, ...
    'connectivity', conn, ...
    'monitors', monitor, ...
    'simulation_length', 5000));

% Perform internal configuration
configure(sim);

% Spatialize epileptor excitability
model.x0 = [-2.0, -1.6];
Run simulation
monitor_output = run(sim);
Convert data to MATLAB format
time = np2m(monitor_output{1}{1});
signal = np2m(monitor_output{1}{2});
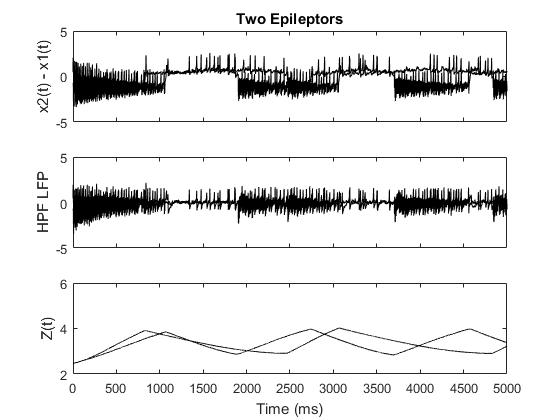
Plot 2 kHz LFP & metabolic variables
NB dimensions will be [mode, node, state var, time]:
figure()

subplot 311
plot(time, squeeze(signal(1, :, 1, :)), 'k')
ylabel('x2(t) - x1(t)')
set(gca, 'XTickLabel', {})

title('Two Epileptors')

% plot high-pass filtered LFP
subplot 312
[b, a] = butter(3, 2/2000*5.0, 'high');
hpf = filter(b, a, squeeze(signal(1, :, 1, :))');
plot(time, hpf(:, 1), 'k')
hold on
plot(time, hpf(:, 2), 'k')
hold off
set(gca, 'XTickLabel', {})
ylabel('HPF LFP')

subplot 313
plot(time, squeeze(signal(1, :, 2, :)), 'k')
ylabel('Z(t)')
xlabel('Time (ms)')